
In creative work, every year is a new opportunity to do more: to push yourself more, experiment more, and grow your skills. That’s certainly true for infographic design. Whether it’s trying a new format or illustration style, there are plenty of ways to push creative boundaries. Luckily for us, designers and infographic creators around the world continue to impress, year after year.
We believe good work should always be celebrated, and we love a good roundup, so we’ve collected some of the most interesting and inspiring infographic design we’ve seen (and, in some cases, had the privilege to create). From branded content to delightful data visualization, animated infographics to static design, here are 75 infographic design examples to get your creative juices flowing. (Oh, and if you’ve found any you think should be added, drop us a line in the comments.)

Animated Infographic Design Examples
As publishing platforms have evolved over the last few years, more and more are showcasing animated infographic design. These eye-catching pieces show that you can bring just about any topic to life through movement. (If these inspire you, here are 3 ways to introduce animation into your static infographics.)
1) “5 Freelancers That Are Changing the World of Work” by LinkedIn

2) “Expand Support Beyond Customer Service” by Zendesk

3) “How to Orchestrate a Solid ABM Team” by Marketo

4) “These Days in Baseball, Every Batter Is Trying to Find an Angle” by The Washington Post

5) “Turn on the Customer Experience Channel” by Zendesk

6) “Are You SLAcking Off?” by Incapsula

7) “Don’t Buy Into These Homebuying Myths” by Realtor.com

8) “Virtual Reality: A Fresh Perspective for Marketers” by Marketo

9) “Automation and the Next Generation of Accountants” by Firm of the Future

Data Visualization Infographic Design Examples
We have always been and will always be major data geeks, so we love nothing more than a solid piece of data visualization. Data visualization gives data designers plenty of opportunities to shine, with subjects ranging from presidents to carbon emissions. Most importantly, these examples prove that even dull data can become beautiful art.
(If you’re working on data storytelling of your own, find out how to design the more common charts and graphs, follow these 25 tips to improve your visualizations, master the ins and outs of data storytelling, and learn how to repurpose your data visualizations to make more compelling content.)
10) “Nuclear Slowdown” by Valerio Pellegrini, Wired UK

11) “Items of Interest” by Paul Button

12) “Surfing in Italy” by Michela Lazzaroni, Stefania Guerra

13) “Basics of Early Childhood Development” by Nerdcore Medical

14) “Diamonds Are Forever” by Valerio Pellegrini

15) “Who is Your President?” by La Lettura Corriere della Sera

16) “The Titanic, Facts and Numbers” by Sara Piccolomini

17) “120 Tastes from Indian States” by Rachita Agarwal

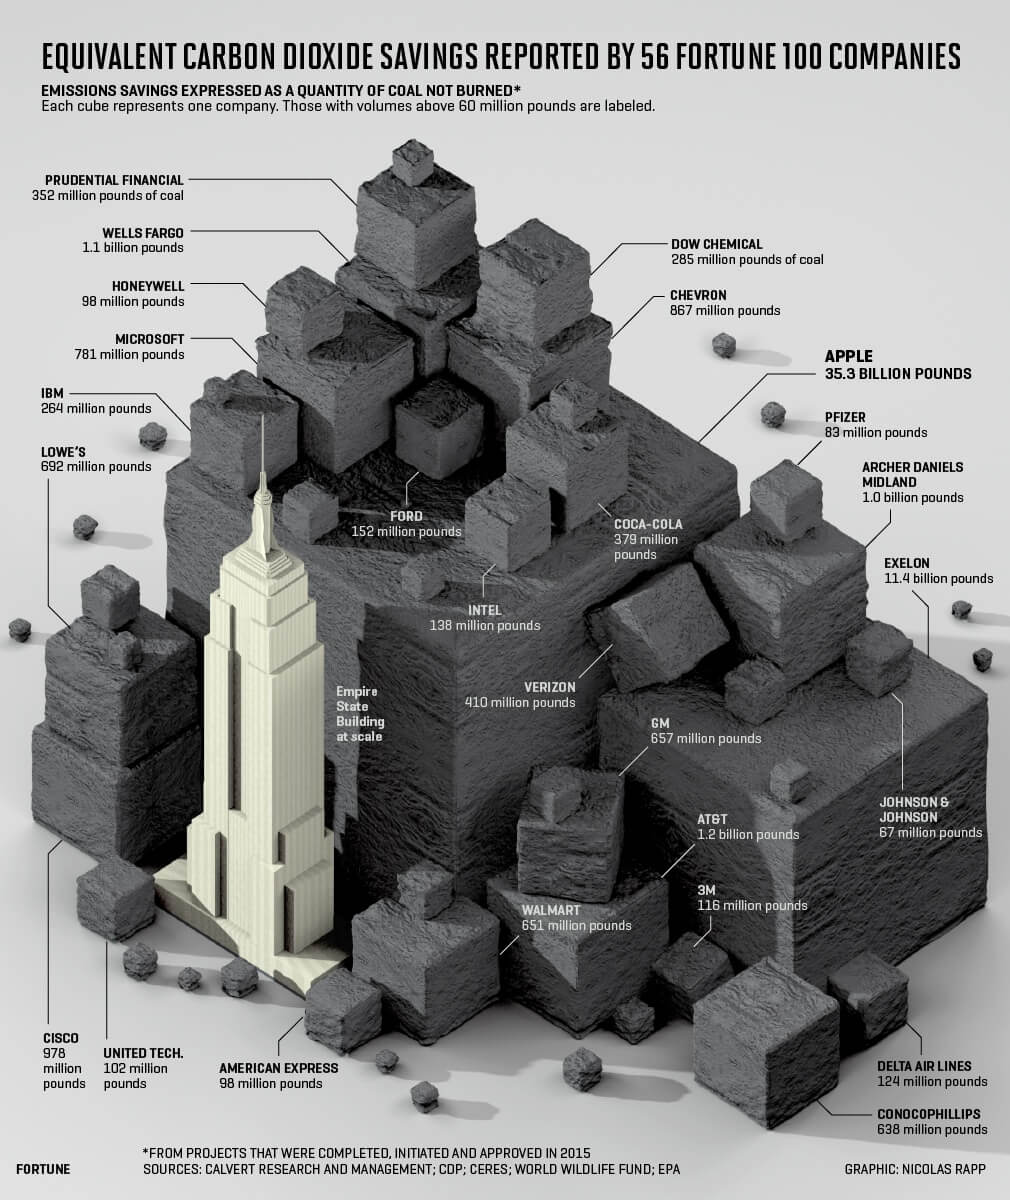
18) “Emissions Change Starts at the Top” by Nick Rapp
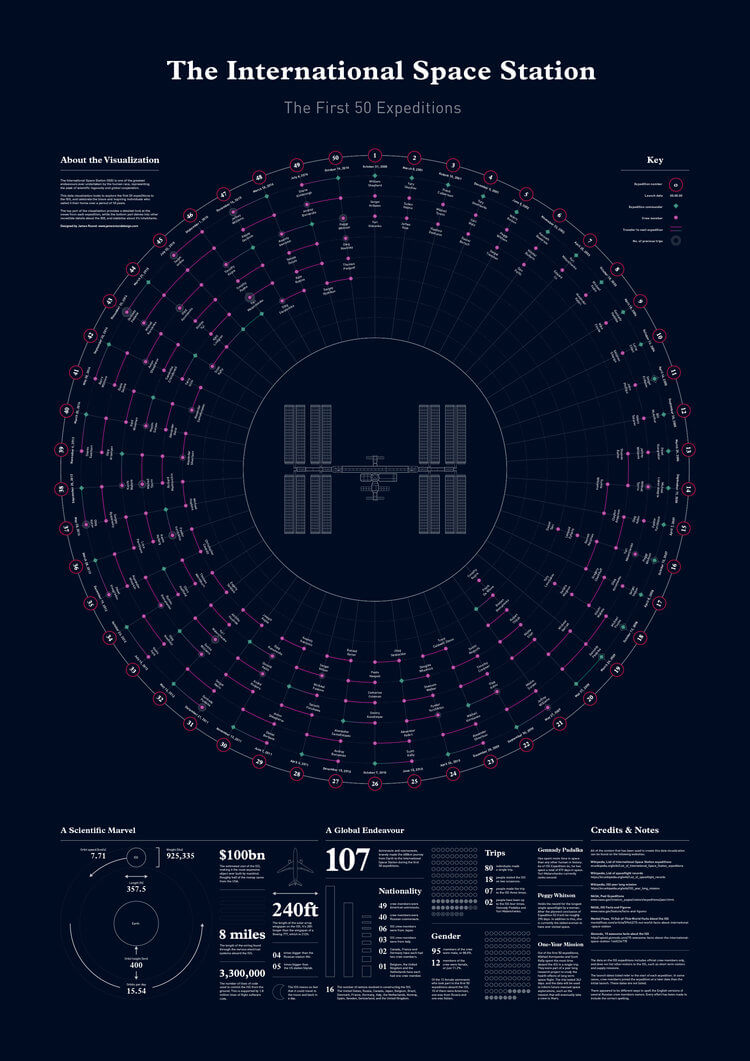
19) “The International Space Station – The First 50 Expeditions” by James Round
20) “The Polarization Of Red And Blue States From McGovern To Trump” by FiveThirtyEight

21) “The World’s Most Dangerous Cities” by Economist

22) “The Wall: A Threat to the Environment” by Sofia Guajardo

23) “Beautiful Trash” by Jeffrey Shaffer

24) “Death in the Air: Air Pollution Costs Money and Lives” by World Bank Group

25) “The Safest Cars of the Last Eleven Years” by Marco Giannini

26) “Which UK Workers Are Most at Risk of Being Replaced by Robots?” by Filippo Mastroianni

27) “The President of the United States – Exploring 228 years of the Commander-in-Chief” by James Round

28) “There’s Big Money to be Made in Asteroid Mining” by Valerio Pellegrini, Wired UK

29) “Sound as Color” by Ronnie Pence

30) “The Discworld, Visualised” by Emma Cosh

31) “Star Trek Duty Roster” by Dave Columbus

32) “This Chart Contains a Few Hidden Surprises About the World Economy” by Howmuch

33) “Triple Play Art” by Tresta Inc.

34) “Biodiversity in Professional Sports” by Shawn Levin

35) “1440 Minutes of Data” by Muskeen Liddar

36) “Why Are So Many Babies Born around 8:00 A.M.?” by Nadieh Bremer, Zan Armstrong & Jennifer Christiansen

37) “100 Days of Summer – Plants in Finland” by Thuy Ngo

38) “The New Top 10 Furnace Cities in China” by Yan Lu

39) “A Visual History of Formula One” by Sports Chord

40) “The Colours of Vincent Van Gogh” by Ravi Mistry

Flowchart Examples
These flowcharts take infographic design to the next level. Their complexity (yet clarity) is something to aspire to, whether it’s diving into Game of Thrones or the transportation industry.
41) “This Is the Tangled Future of Tech and Transportation” by Business Insider

42) “Alt Music History” by Dorothy Studio, Wired

43) “Unraveling Death in Game of Thrones” by Heather Jones, Time

Illustration Examples
Illustration is a standard tool in infographic design, but creative infographic designers take it to the next level. From creative characters to clever themes, these illustrated infographics use design to enhance the story and make it more engaging. (Whether it’s illustration or data visualization, make sure to avoid these 8 visual communication mistakes.)
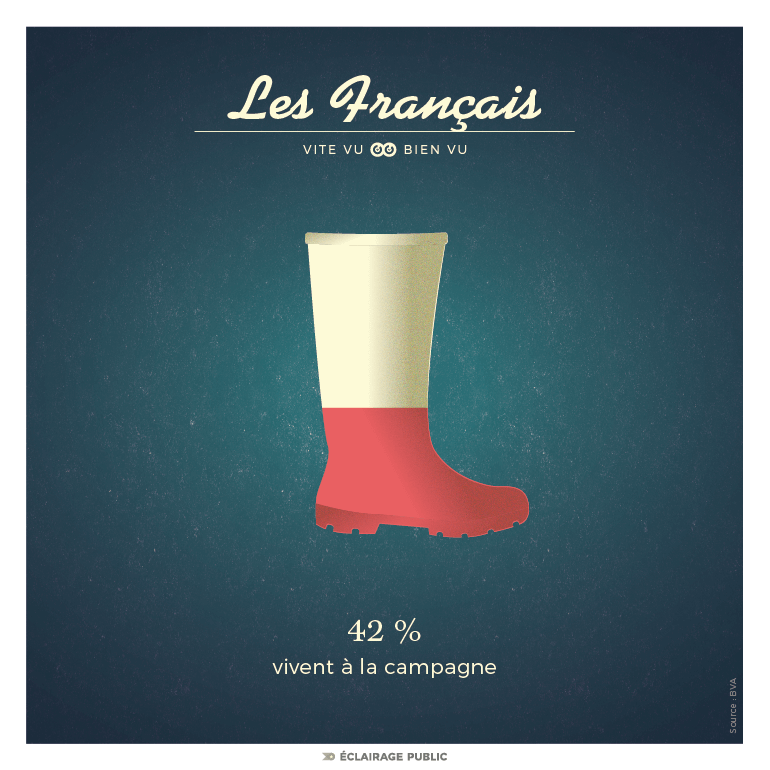
44) “Mini Infographics” by Vite Vu Bien Vu
45) “The Psychology of the Perfect Marketing Video” by Explainify

46) “Biggest Content Marketing Mistakes” by SEO1Click

47) “Herbal Medicine” by Shijie Chen, Wantao Yu, Nanjing University of Art

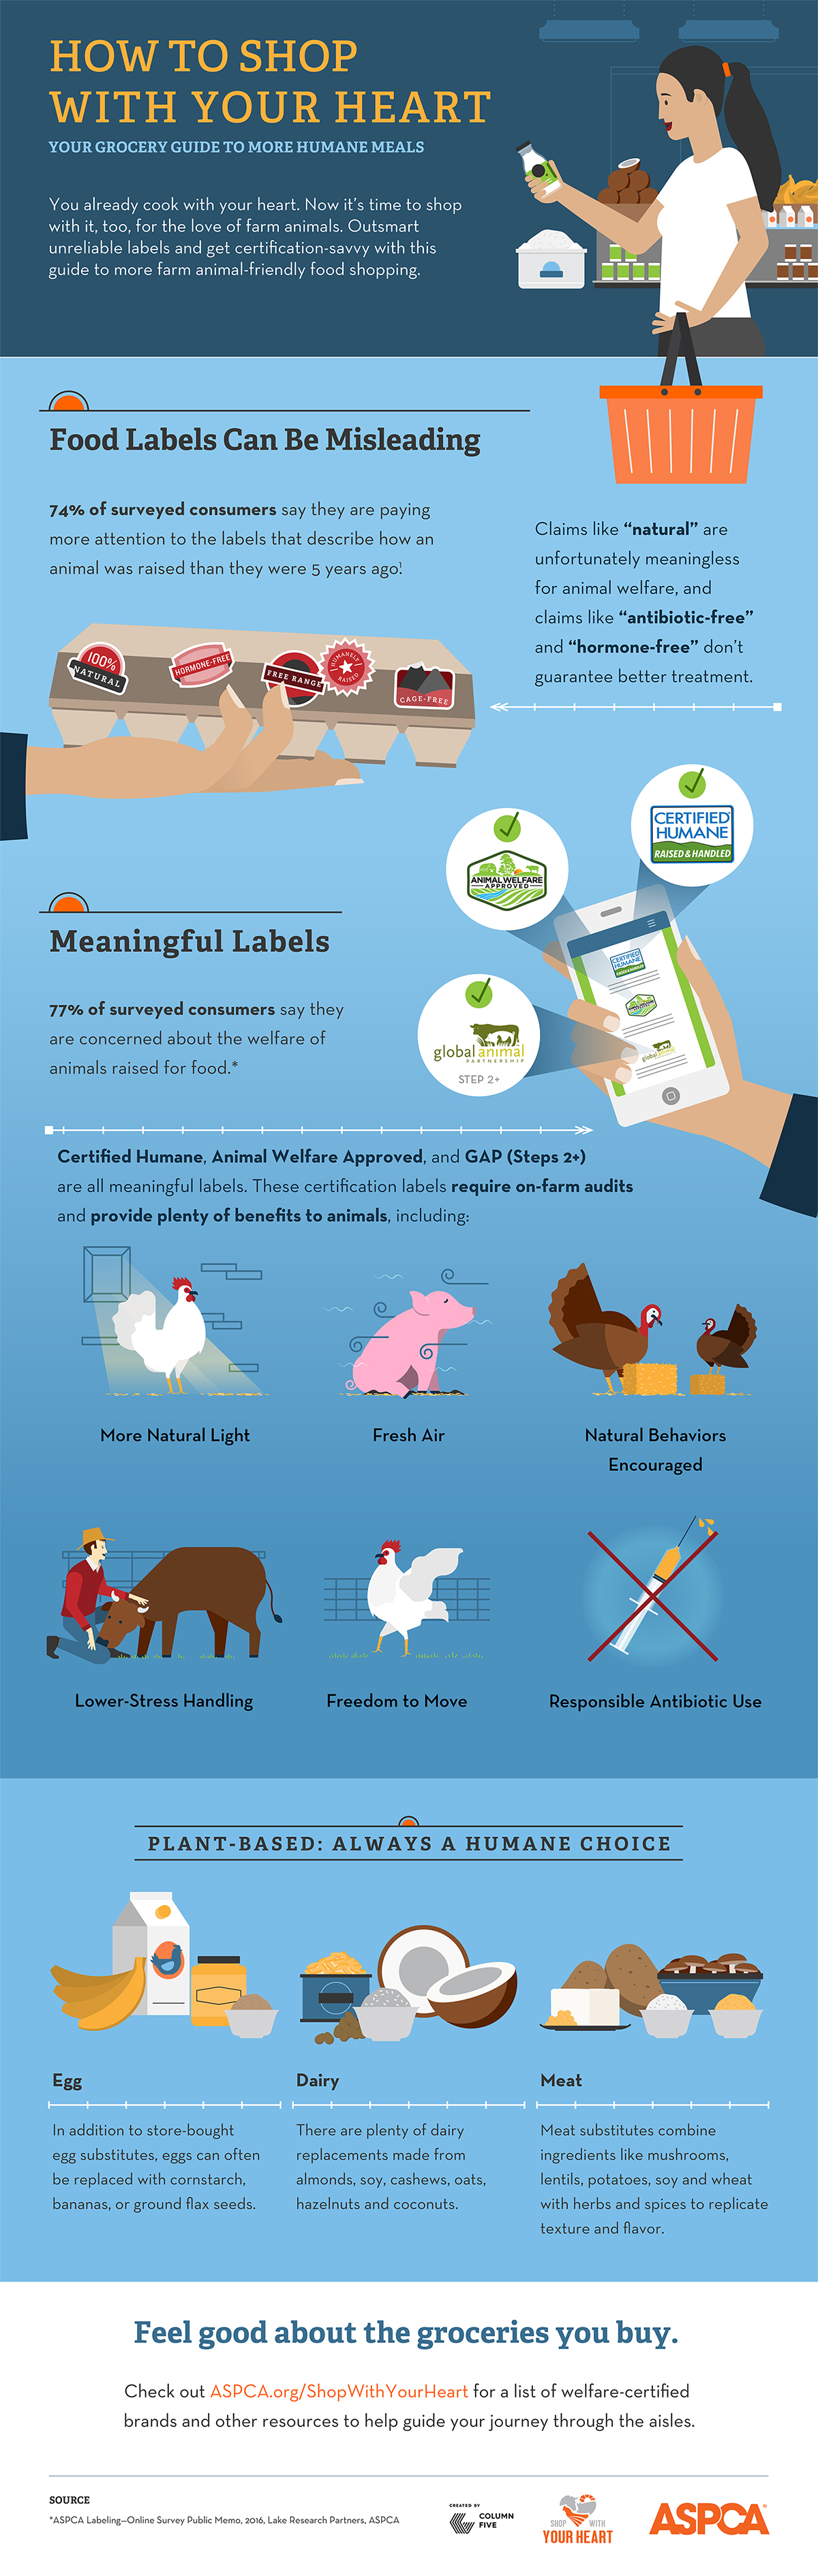
48) “How to Shop with Your Heart” by ASPCA

49) “Secure Your Data from the Inside Out” by Imperva

50) “The (Exercise) Science of Injury Recovery” by Concordia University

51) “Veganismo” by Saioa Perona, Bau Design College of Barcelona

52) “Infographic of the Quran” by Izzat Haikal

53) “Chat Systems” by Randall Munroe, XKCD

54) “Iconic Movie Weapons” by MDB

55) “Infographic of Plants” by Nanjing University of the Arts, Zhang Biqi

56) “Facing the Paradigm Shift – Siemens Healthcare” by Persuaid

57) “PhillyRow: Anatomy of a Rowhouse” by PhillyRow

58) “Beyond Turkey and Food Comas” by Under Armour

59) “Super Software Defeats Manual Mayhem” by Skedulo

60) “Hunger Games” by Course Hero

61) “The AI-Empowered Marketer” by Marketo

62) “Longboard Facts” by Paula Terra Bosch

Map Examples
Maps don’t have to be boring, as these examples prove. No matter the subject, the right design can make a map so beautiful you’d be tempted to put it on your wall.
63)“Women Farmers in the Loneliness of Onion Fields” by Agnès Stienne, VisionsCarto

64) “The Invisible Forest” by Alessandro Zotta, Politecnico di Milano

65) “The State of the Nation” by Adam Sharratt

66) “Map of Computer Science” by Dominic Walliman

67) “Bears of Finland” by Annukka Mäkijärvi

68) “Deportations from the US” by South China Morning Post

69) “The Goddesses of Venus” by Eleanor Lutz

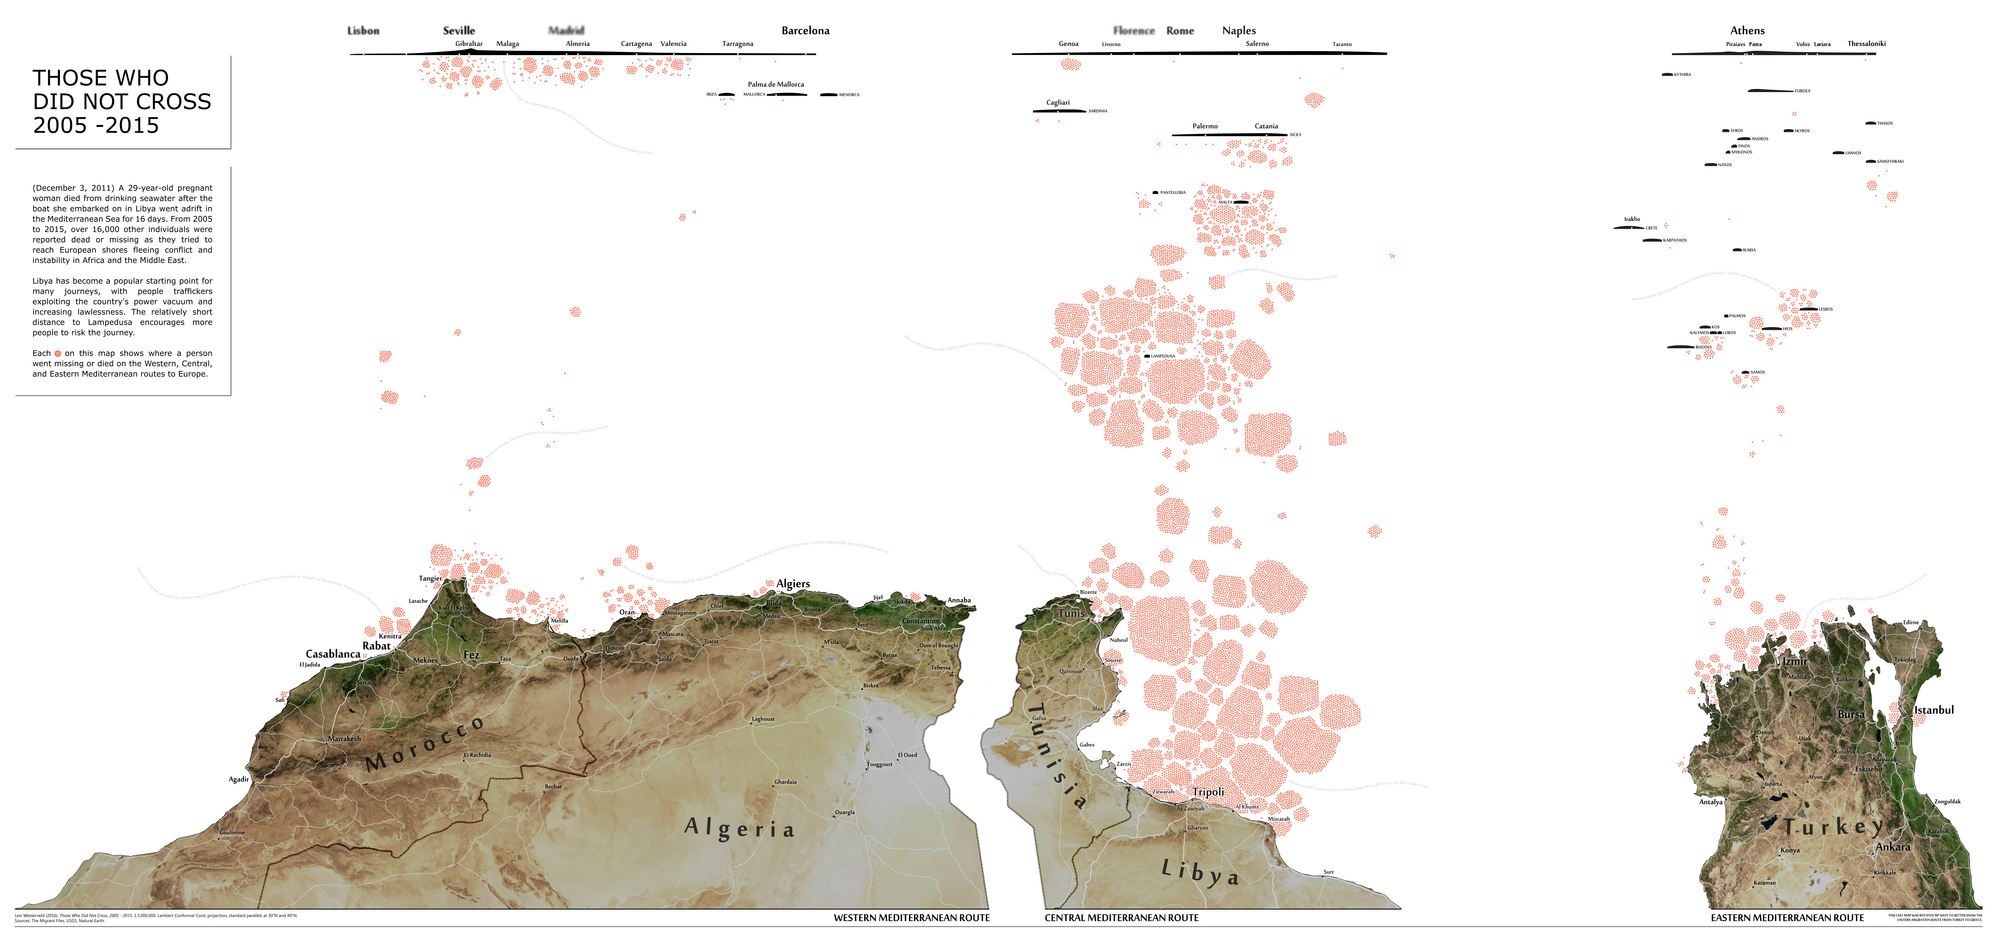
70) “Those Who Did Not Cross” by Levi Westerveld

71) “On Their Way: the Journey of Foreign Fighters” by Density Design Lab

72) “The Tallest Buildings in the U.S.” by Marco Giannini

73) “World Song Map” by Dorothy Studio

Photo Examples
Photography can be a great tool when it comes to infographic design. Although it isn’t used as much as other styles, it is quite effective to add personality to a piece.
74) “See Who’s on Bing” by Microsoft

75) “World Cocoa Markets Made of Chocolate” by Pierre Carrey and BiG

How to Create Better Infographics
From content marketing, to client reports, to sales materials, infographics are one of the most effective communication tools to communicate at every level of your organization. But not all infographics are created equal. To make sure yours are as effective as possible, follow these best practices.
- Get inspired by great work. Check out our roundups of technology infographics and B2B infographics to see more great examples from all industries.
- Use data from credible sources. Here are 100+ sources of free data, plus 9 places to look for data in your own organization. (BTW, internal data in one of the best sources of unique and original stories.) Don’t forget to source your data correctly, too.
- Find the stories in your data. Follow these steps to dig into your data, or download our free e-book, The Content Marketer’s Guide to Data Storytelling for more tips on bringing your data stories to life.
- Craft a strong infographic narrative. A strong infographic tells a single story. Find out how to communicate your story in the most effective way.
- Follow best infographic design practices. Strong data visualization is crucial to create a great infographic. Find out what makes a data visualization memorable, learn how to design the most common charts and graphs, and avoid the 15 most common infographic design mistakes.
- Optimize your production process. Oftentimes it’s the little things that can make or break your creative process. Learn how to make your process easier with our best tips to create great infographics, based on everything we’ve learned after making 4,000 infographics.
- Mix up your styles. It’s easy to get stuck in a creative rut. But there are plenty of ways to play with infographic design. Here are 7 design styles to try, and 10 great examples of minimal but effective infographic design.
- Keep your infographics on brand. The more consistent your content looks, the easier it will be to differentiate yourself. Make sure you have a strong visual identity.
- Optimize for SEO. Find out why infographics are such a great tool for SEO, and use this handy checklist to optimize your infographics for sharing.
- Distribute them effectively. It doesn’t matter if you’ve made the best infographic of all time. If nobody sees it, it won’t achieve its goal. Find out how to promote your infographics like an agency would, and follow these tips to get publishers to feature your infographics. You can also learn more about how to use microcontent to break your infographics into easily shareable pieces on social.
- Repurpose them. Infographics and data visualizations can be easily reused to create fresh content or enhance content you already have. Find out how to turn your old infographics into animated infographics, e-books, and more.
And if you need a little help with your own infographic design, consider bringing in an infographic design company. Here’s how to find the right agency for you, plus a few tips to work together more effectively. Of course, we’re always happy to talk shop, too.

Let's upgrade your marketing game
Get fresh tips, how-tos, and expert marketing advice every week. (15,000 people already are.)

