There are many tools you can use to tell your brand story, and each have their own advantages. We’ve covered many of them, especially data visualization and infographics. These data storytelling formats are useful, but there is another format that is often forgotten: interactive stories. This format brings data to life in exciting and dynamic ways, which is why we love it.
If you haven’t experimented with interactive stories—or even heard of them—here’s what you should know.
What Are Interactive Stories?
Interactive stories, infographics, or visualizations refer to a specific type of content, mostly found online. In its simplest form, interactive infographics are any web-based content that lets you interact with the information or data on screen. Technically, there are two features required to make something an interactive:
- Human input: You should be able to control the visual representation in some way. This might be possible through mouseovers, clicks, drop-down menus, checkboxes, or other features to let you interact with the information on screen.
- Response time: Your actions should affect the visualization in a timely manner. When you do something, you’ll see something on screen.
In short, it’s the communication of data in an interactive way. (For the most part, we’re referring to online interactive stories, but real-life interactive installations, A/R, or VR experiences also count.)
What Are Interactive Stories Used For?
While there are many different formats for brand communication, interactive infographics are uniquely suited to help brands communicate in specific ways or deliver unique experiences. In general, you are most likely to see them used for data storytelling, fixed-narrative storytelling experiences, entertainment experiences, or practical tools. Depending on your goals, some applications may be better than others.
1) Data storytelling
Good data stories come from good data, but sometimes you have far more data than a single static infographic or white paper can contain. In these instances, interactive infographics are the best way to effectively present what is otherwise overwhelming information. Making that data easier to navigate helps the audience interact with and synthesize that information in a pleasant way.
To deliver these data stories, interactive infographics usually take one of two specific approaches: narrative or explorative. Not every data interactive falls clearly into each category. Some offer a blend of the two, but there are benefits to each.
1) Narrative: This approach guides readers through the data in a linear fashion, delivering a single narrative that conveys context and insight and often gives viewers a specific takeaway.
Example: The Anatomy of a Breach interactive we created for Microsoft guides readers through a data heist, crafting a specific story around the data breach to emphasize how important data security is.

This type of interactive storytelling usually requires fewer resources to create because it is a simple, contained story.
2) Explorative: This type of storytelling puts viewers in the driver’s seat, letting them browse information and extract their own relevant or interesting stories.
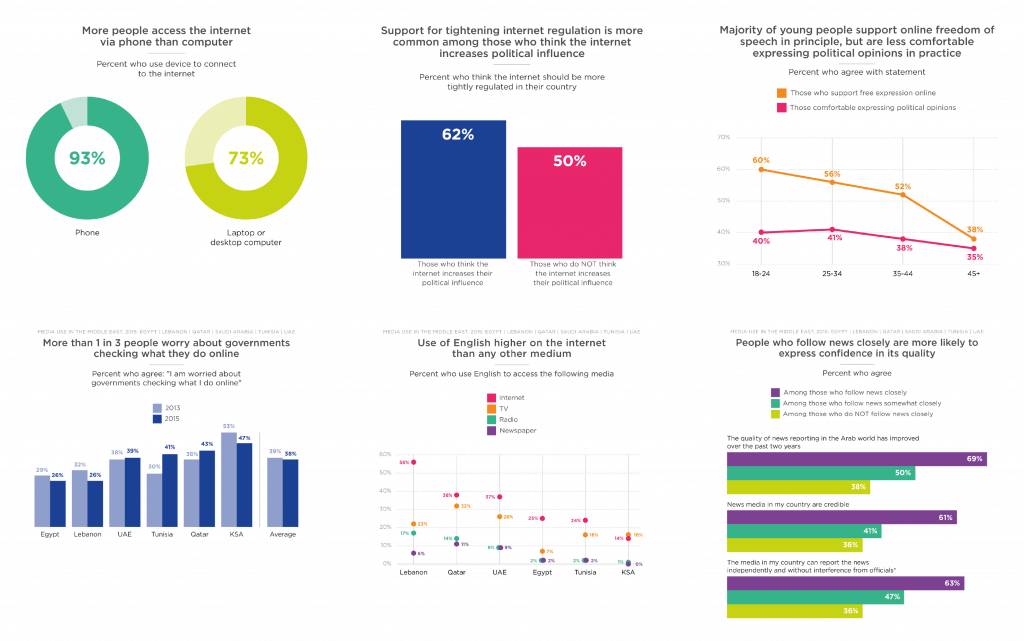
Example: Northwestern University Qatar conducted a massive survey on Media use in the Middle East. With so much data—an incredible 10 million cells to be exact—a static infographic would be impossible. We turned the information into a streamlined, colorful, easy-to-navigate experience.

This type of interactive is good for large or complicated data sets; however, because it usually involves large amounts of data, it requires more resources to produce.
2) Fixed-Narrative Storytelling Experience
Even in the absence of hard data, interactives are still a great way to deliver any sort of information or story. Narratives offer a contained environment, which gives you control over the story. Imagine a simple click-through slideshow or a narrative enhanced with interactive elements, such as animations. This type of storytelling is best used to deliver a specific message.
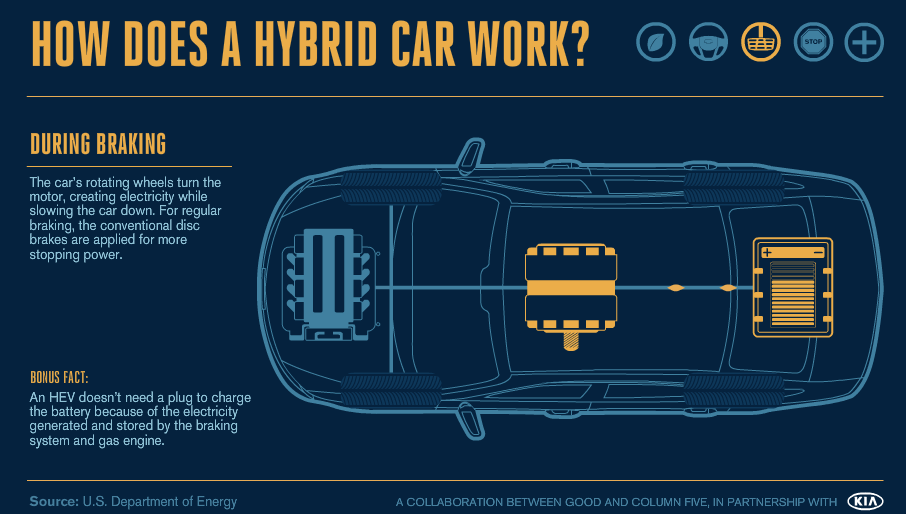
Example: We collaborated with Good magazine to create an interactive experience that allowed readers to learn about how a hybrid car works by interacting with different elements.
3) Entertainment Experiences
Viewers crave content that entertains or inspires. When you are looking to create novel experiences or give a piece of content an entertaining spin, interactivity is a fantastic way to do it. Any piece of content can be enhanced by:
- Audio
- Video
- Animation
Example: Our Beyond the Beat interactive tells the story of African-American musicians who made significant contributions to music. Copy, illustrations, and audio samplings bring their stories to life.

4) Tools
Interactive tools can help viewers complete a task, get a specific piece of information, or explore an interesting subject. (They can also be used to help your own company gather data.) For that reason, they provide immense value. Some common applications include:
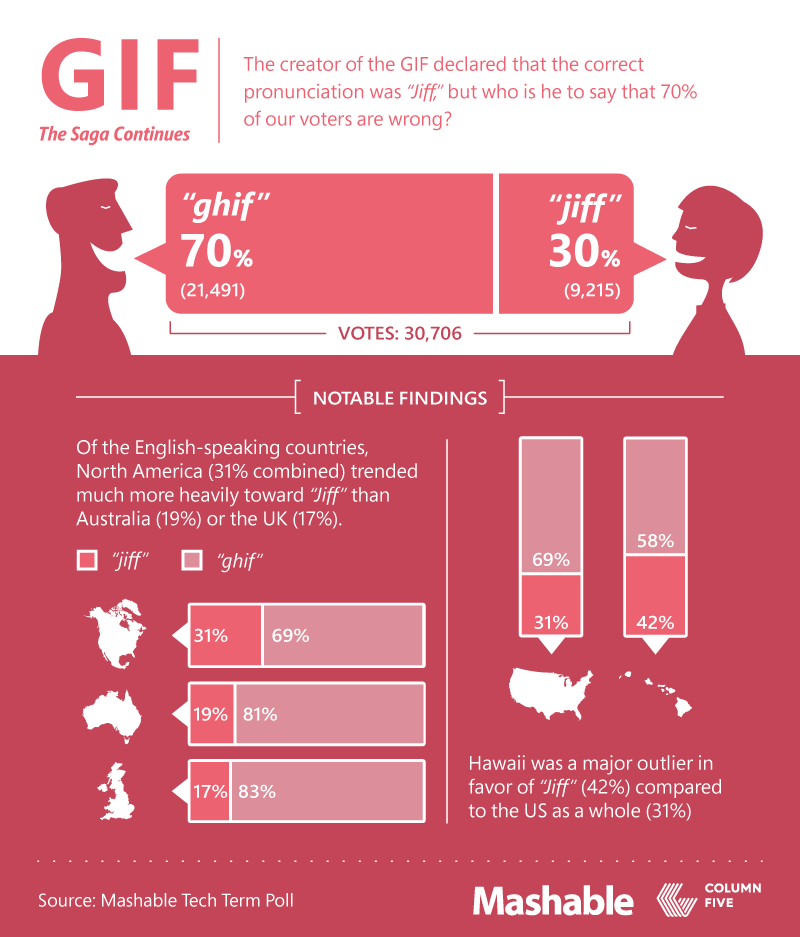
Example: We collaborated with Mashable to create a quiz that polled their readers about how they pronounce certain tech terms. (The results were later visualized, providing even more content.)

3 Reasons Interactive Infographics Work for Brands
Data storytelling a fantastic storytelling tool, but interactives are particularly well-suited to help marketers communicate with their audiences. Whether you’re trying to increase brand awareness, engage your audience, inform them about a product, or help them make a decision, interactives can give you an advantage.
1) They make valuable information easily accessible: Audiences want content that is relevant, useful, and most importantly worth their time. Delivering information in an easy-to-understand way is a huge service to them.
Providing this type of useful content also shows your audience you care and are interested in helping them access the information they want and need. The same goes for interactive tools that provide utility, such as calculators or product demos.
These unique resources make your audience look more fondly on your brand.
2) They encourage personal engagement: The goal of all content marketing is to establish a relationship with your reader. With interactives, you are welcoming them into the experience and encouraging them to come along with you.
Interactives put your audience in the driver’s seat of the story. Narratives guide them through a set experience, while explorative interactives allow them to set their own pace as they discover information. But both put interaction in their hands, encouraging them to dive in.
“If you think about visualizations as a mass medium, something made for huge audiences, interaction turns them into very personal tools,” says interactive expert Dominikus Baur. “Interaction enables people to adjust a visualization to their own needs and ask it different questions.”
This is a powerful way to create an intimate experience that helps form relationships.
3) They can provide real-time storytelling: Unlike static formats, an interactive with a dynamically updated dataset allows viewers to access real-time data that is always up-to-date. Static visualizations may need to be manually updated or adjusted, but a dynamic interactive just requires uploading the new data.
This convenience helps you provide accurate information quicker, giving you a competitive edge.
Are Interactives Right for Your Story?
Before you dive into interactives, make sure you have a story that can be told through an interactive. Learn more about the 7 ways interactive infographics can tell your story and ask yourself these 5 questions to find out if you really have an interactive story.
If you’ve decided that you’re ready to hit the ground running, you might want to take a look at these 101 fantastic infographics to get a little inspiration and try these 5 tips to help your interactive infographics get the most traffic.
If you’re curious to see more of our work, head on over to our portfolio to see the many interactive infographics we’ve created for brands and publications. You can also get more tips on creating great interactives by checking out these posts.


