Data storytelling is one of the best forms of content marketing. It’s grounded in fact (something the world needs more than ever), and it can speak to the issues that people are most interested in. And while data storytelling may sound complicated, marketers are well-suited to find the best data stories because they know everything about their audience: their interests, pain points, needs, and most importantly, how to speak to them. (That’s one area where data scientists often struggle.) Luckily, to create good data storytelling, you just need a few solid data sources to start. And guess what? You already have access to an impressive library of totally unique, exclusive data—within your own company.
Why Internal Data Is Your Secret Power
All data storytelling can be effective, whether it comes from external data sources or internal. But internal data is especially powerful for content marketers. Why? Because the information sitting in your surveys and spreadsheets is uniquely yours. When you bring this data to life, you can create content that is:
- Original
- Interesting
- Credible
- Newsworthy
- Exclusive
In short, stories that come from internal data are the content marketing holy grail.
Where to Find Good Data Sources In Your Company
There is plenty of data to find behind your four walls. Here, we’ve rounded up some of our favorite go-to data sources to inspire your next piece of content. The best part? As you start to explore these sources, you’ll notice data stories where you least expect—and discover more ways to use data storytelling to connect with your customers, your employees, and more.
1) Surveys
Surveys are one of our favorite data sources because they let you tap into the thoughts and feelings of specific groups. These insights can provide great fodder for stories, and help you educate your customers, employees, or industry peers.
Example: We helped Newscred visualize the results of their content marketing survey in an animated infographic. This helped bring the most interesting insights to life in a creative way.

2) Customer Data
This information has long been used to help companies create a better experience or product for their customers, but for marketers, it can provide valuable insight into what your customers want and need in their content. Whether it’s more education around a subject, or inspiration for how to use your product, digging into your surveys can help you find all sorts of ideas.
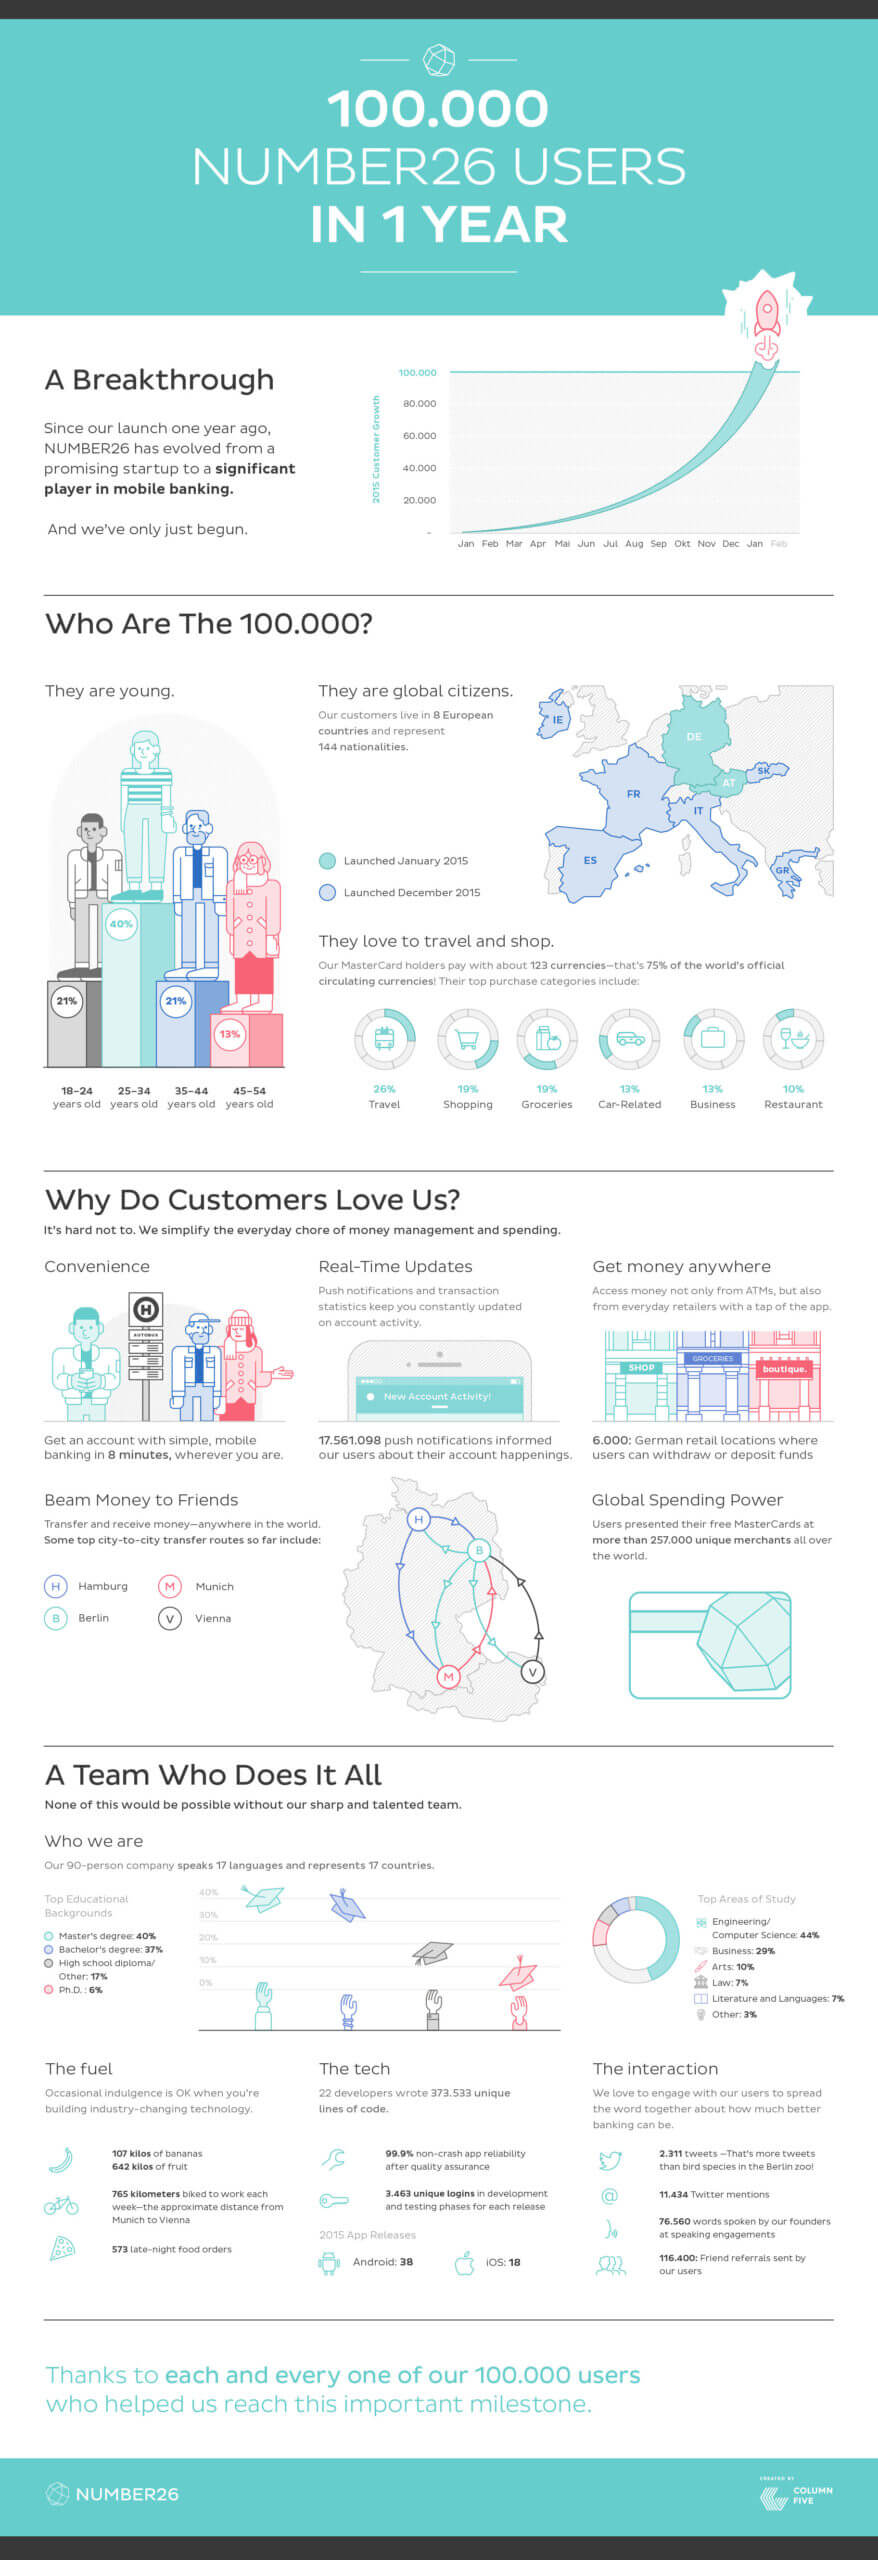
Example: To celebrate Number26’s first year in business, we created an infographic to show their success, using insights from customer data.

Tip: The information you get from customer data can also help you build stronger personas (psychographic maps of different audience segments). With clear personas, you can better vet your content marketing ideas and make sure they provide real value.
3) Company Initiatives
Data storytelling offers a chance to shed light on many different aspects of your company. Even better, all of that data is right in your hands. Think of ways that information might be used to educate people about what you do or causes that are important to you.
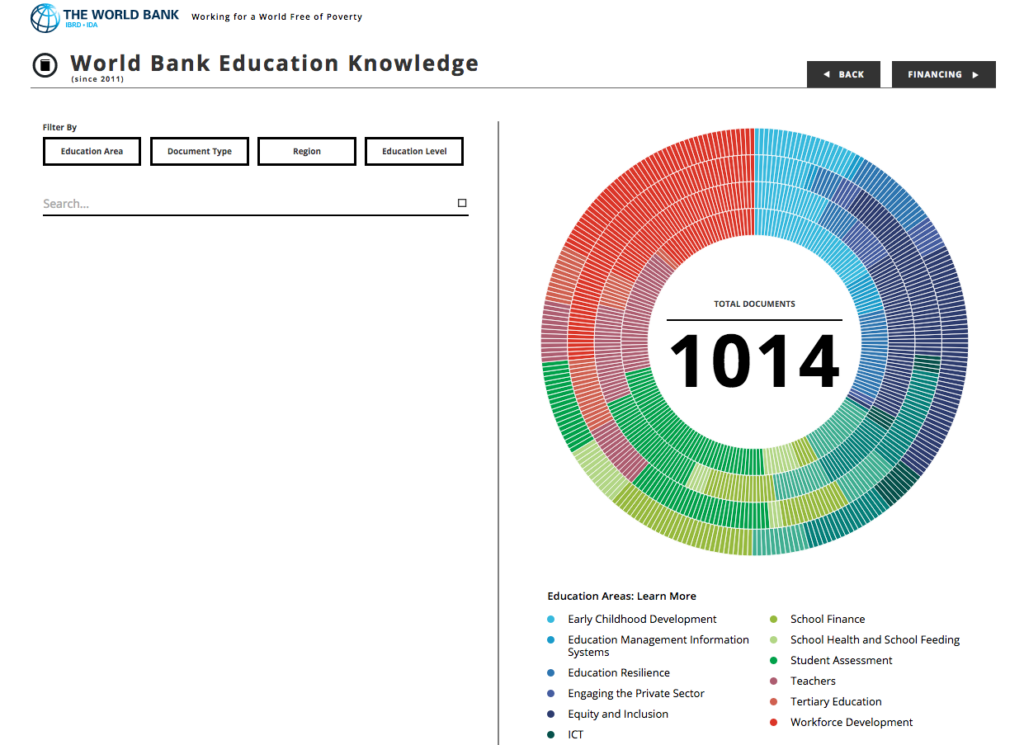
Example: We partnered up with The World Bank to create an interactive data visualization that allows users to explore the different ways the company is funding new educational initiatives worldwide.

Tip: You can also use data to highlight your values. For more inspiration, here are 10 brands that turn their brand beliefs into content.
4) Analytics
From website visitors to page views, you have access to a ton of relevant information about who consumes your content—and what they consume. This can help inform your stories in two great ways.
- When you know what people respond to most, you can identify general stories they’ll be interested in.
- Your analytics data can become its own story. For example, if a new content strategy resulted in a 30% increase in web traffic, that’s a great story.
Example: We published an article that told the story of how we revamped our marketing strategy and increased our leads 78% in only 6 months. In it, we shared our internal data and offered tips to help others improve their own strategy, too.
Tip: If you don’t have strong data, you might be measuring the wrong things. See our guide to track the right metrics for your content strategy.
5) Company Reports
Reports and white papers contain valuable information that can easily be turned into data storytelling. Even better, the data contained in these reports can be published on social as microcontent, helping to further promote the original piece of content.
Example: We helped HighFive turn insights from their “Workplace Culture and Communication” report into an engaging infographic.

6) Customer Results
Case studies backed up by strong data are particularly compelling, as you can directly tie your efforts to your outcome. Using data to create strong case studies is a great way to showcase how your brand solves problems—and gets results for its customers.
Example: Hubspot tells the story of how they helped Amerifirst Home Mortgage increase web traffic 3.8x and increase leads 51.7x—impressive numbers that were made possible by Hubspot tools.
7) Annual Reports
Beyond the standard legal requirements and financial disclosures, annual reports include a wealth of interesting data. Creative data storytelling can really bring this info to life as infographics, interactive infographics, motion graphics, and more.
Example: We helped Girls Who Code turn their annual report into an interactive experience that told the story of the 30,000+ girls they’ve helped.

Tip: For more annual report inspiration, find out how to tell a strong story in your report, and check out these 40 examples of incredible annual report design.
8) HR Data
From demographics and salary to vacation days and employee surveys, your HR department has access to a wealth of data. This can be translated into interesting stories that help promote your employer brand (and demonstrate transparency).
Example: When Salesforce did an equal pay assessment of 50,000 employees, they ended up paying $2.1 million in salary adjustments. By writing about the process and breaking down the numbers on their blog, they used data storytelling to maintain transparency, discuss an important topic, and show that they are committed to being an industry leader in diversity and equity.
Tip: If you want to learn more about how to build a strong employer brand, see our guide to build an employer brand, and download our Employer Brand Toolkit.

9) Culture-Centric Data
Your coworkers and company culture can also make for interesting or entertaining data storytelling. This is especially great fodder for social media, where you can really show off your brand personality.
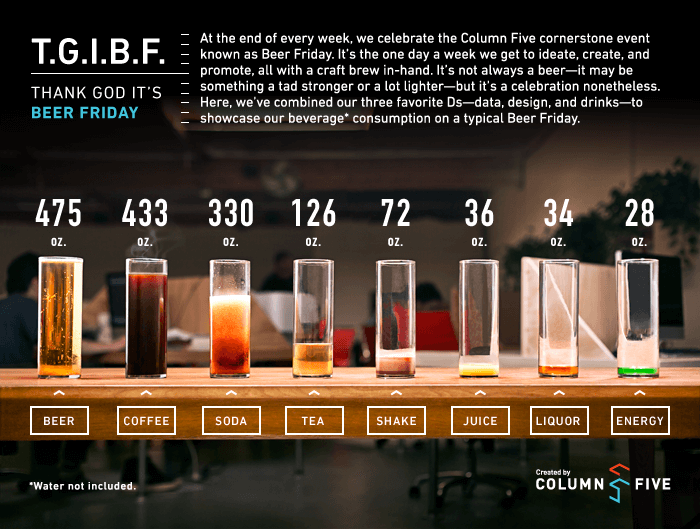
Example: As data geeks and lovers of our Beer Friday tradition, we once tracked a day’s worth of company liquid consumption and turned it into a fun little infographic.

Tip: For more ideas on how to tell stories about your people, see our guide to culture marketing, and download our free e-book Culture Marketing: How to Turn Your Brand Heart Into Content That Matters.
Learn to Tell Better Data Stories
No matter what data story you’re telling, the key is to make sure your story is credible, interesting, and delivered effectively. For more tips to do that…
- Download our free e-book The Content Marketers’ Guide to Data Storytelling to find out how to partner with data analysts, find interesting stories, and turn them into compelling content.
- Follow these tips to extract insights from your data.
- Learn how to craft an effective data narrative.
- Follow best practices to design effective charts and graphs.
And if you still need a little help with your data storytelling, holler at us. We’d love to turn your numbers into fresh, new stories.


