Great infographics come from all industries, whether you’re a cloud computing company or a cupcake distributor. But it can be easy to fall into a design rut—especially if the topic feels less than inspiring. Still, there’s a lot you can do to turn your B2B infographics into creative pieces of content.
The Top 50 B2B Infographics
Here, we’ve broken down 50 beautiful and inspiring infographics, arranged by design type. We hope it helps inspire you to think bigger with your B2B infographics.
Illustration
Illustrations can do a lot to liven up even the most dull topics (no offense). From colorful characters to the full-on comic book treatment, these B2B infographics prove a little creativity can go a long way. (But no matter what your aesthetic is, make sure you avoid these 8 common design mistakes.)
1) “The Future of Retail” by Forbes and Samsung

2) “6 Ways to Attract a Fanatical Brand Following” by Get Satisfaction

3) “The Search for the Pink Unicorn” by Jobvite

4) “The Female Entrepreneur: Women Who Run Their World” by USC Marshall

5) “Portrait of a Content Marketer” by Uberflip

6) “B2B Social Marketing Universe” by Marketo

7) “Snacking in the Office” by Papas Group

8) “The Staggering Cost of a Bad Hire” by Mindflash

9) “Managing and Maintaining Team Solidarity with a Remote Office” by Villanova University

10) “Corporate Culture Mindset” by NowSourcing

11) “Software Development” by Toggl

12) “Biggest Content Marketing Mistakes” by SEOOneClick

13) “Free the CIO” by the Lucidworks

14) “Your Digital Marketing Roadmap” by Komplete

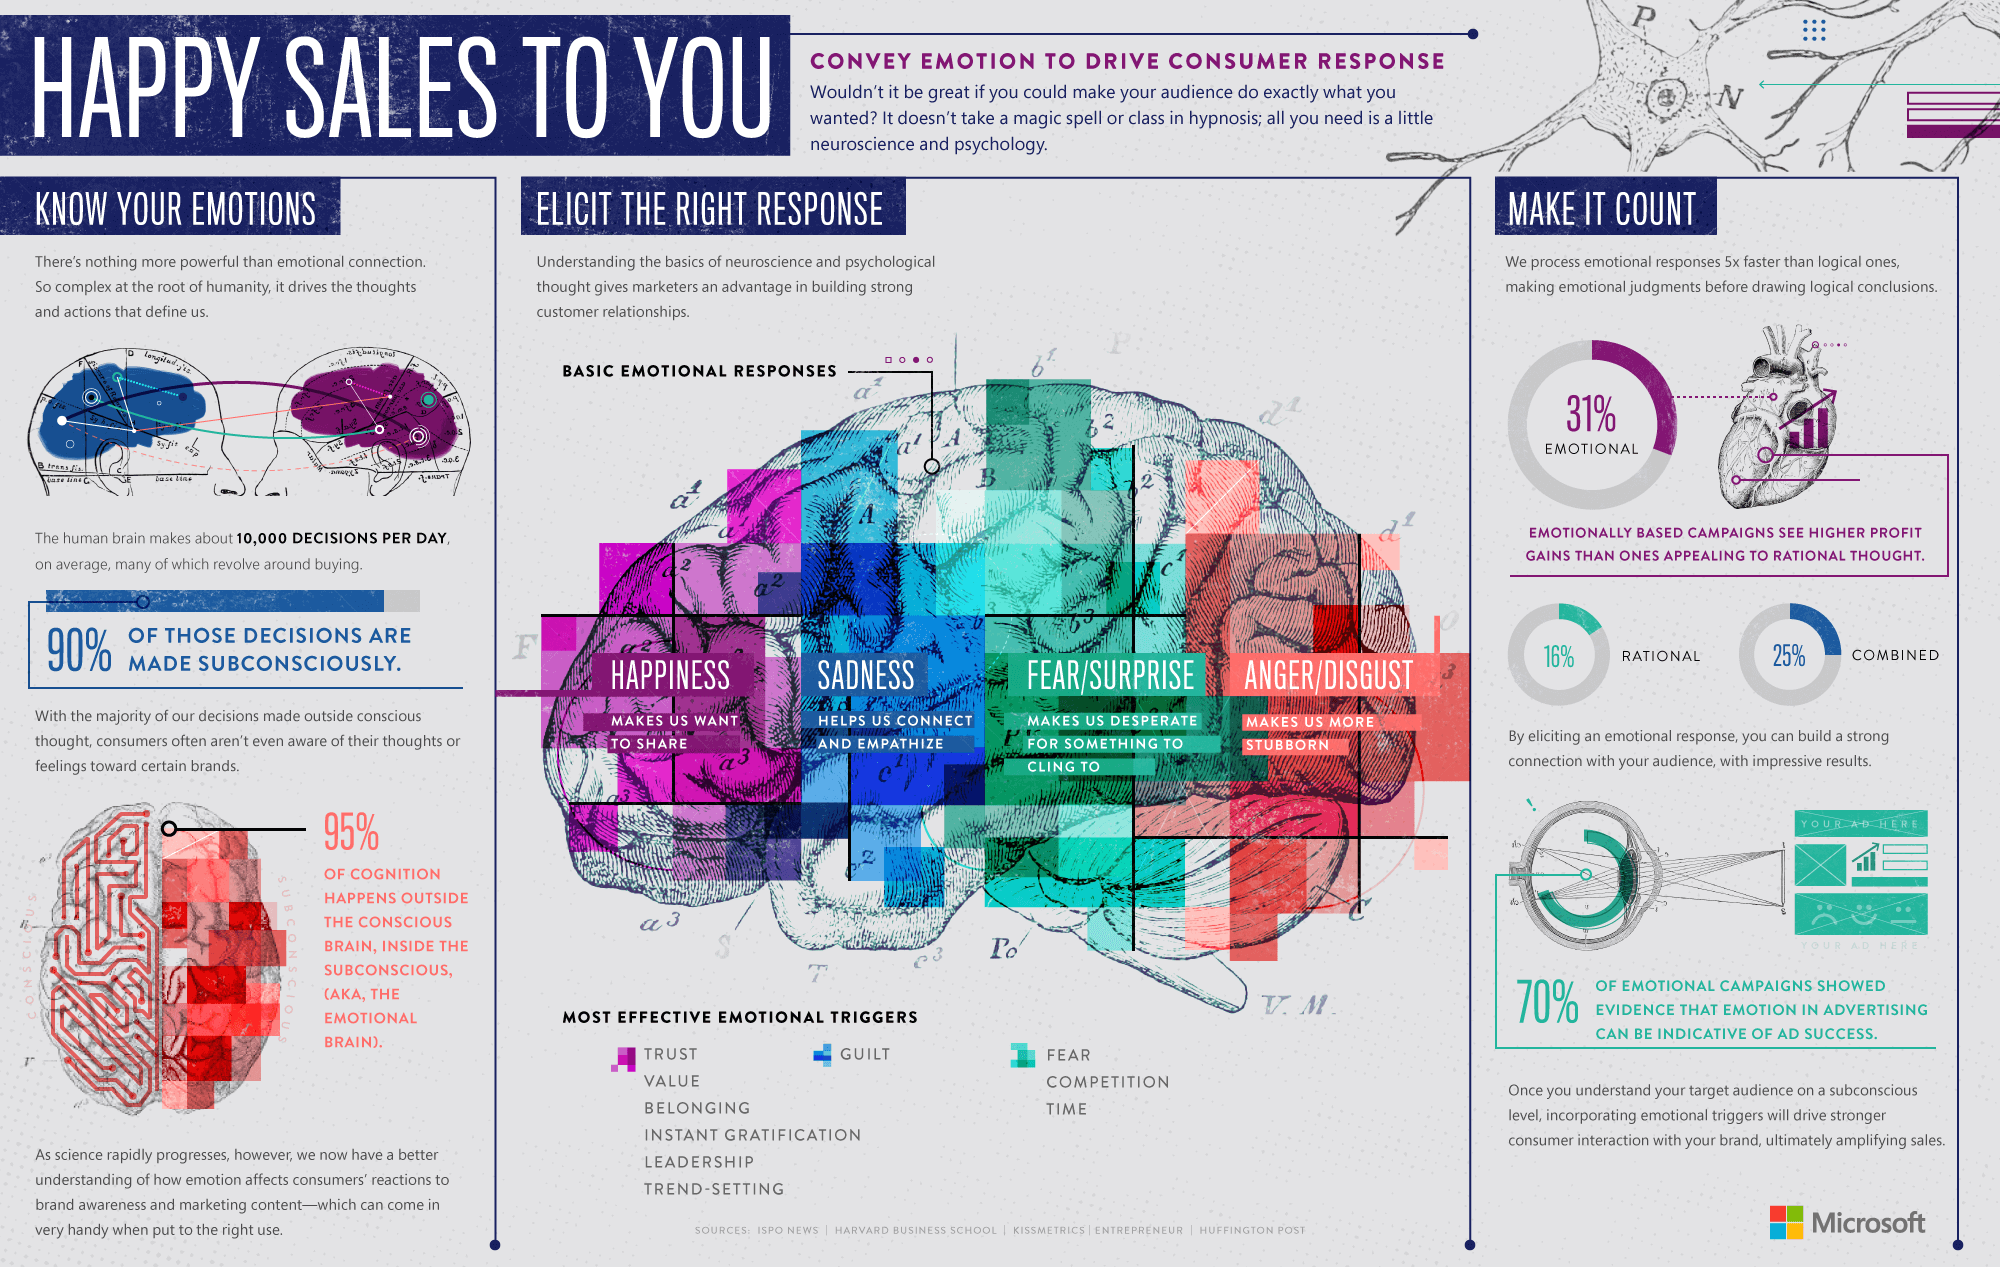
15) “Happy Sales To You” by Microsoft
16) “Cut Through B2B Information Overload with Effective Storytelling” by LookBook HQ/Beutler Ink

Photography
Most infographics take the illustration route, but photography can be a nice change of pace—and you don’t have to go with a stock photo vibe either. Whether used to add personality to a graphic or incorporated into data visualization, there’s a lot more you can do with photography than you think. (For more inspiration, here are a few more types of unusual design treatments you can give your infographics.)
17) “Ascend to New Heights in Content Marketing” by Captora

18) “Paid Parental Leave Benefits” by Jobvite

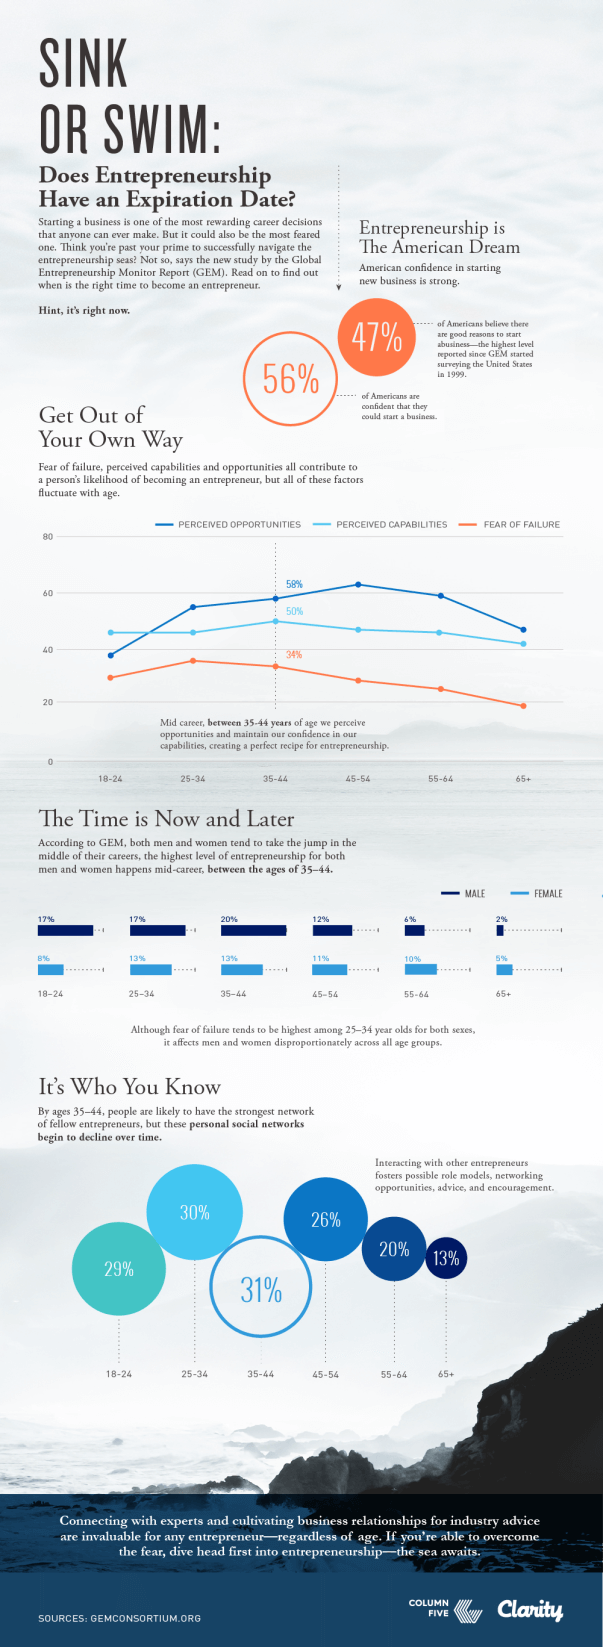
19) “Sink or Swim” by Clarity
20) “A Well-Balanced Blog” by LinkedIn

21) “Mad Men of the Millennium” by Marketo

Data Visualization
Not all B2B infographics include data, but those that do are able to anchor a strong narrative around that data. And when it’s expertly designed, the story is that much stronger. These infographics show some of the best examples of data design, from minimal takes to stunning visualizations. (To make your data visualizations stronger, follow these 25 tips for data design.)
22) “Bad Service Blues” by Get Satisfaction

23) “Hospitals: How Well Do You Know Your Referral Patterns?” by Avalere Health 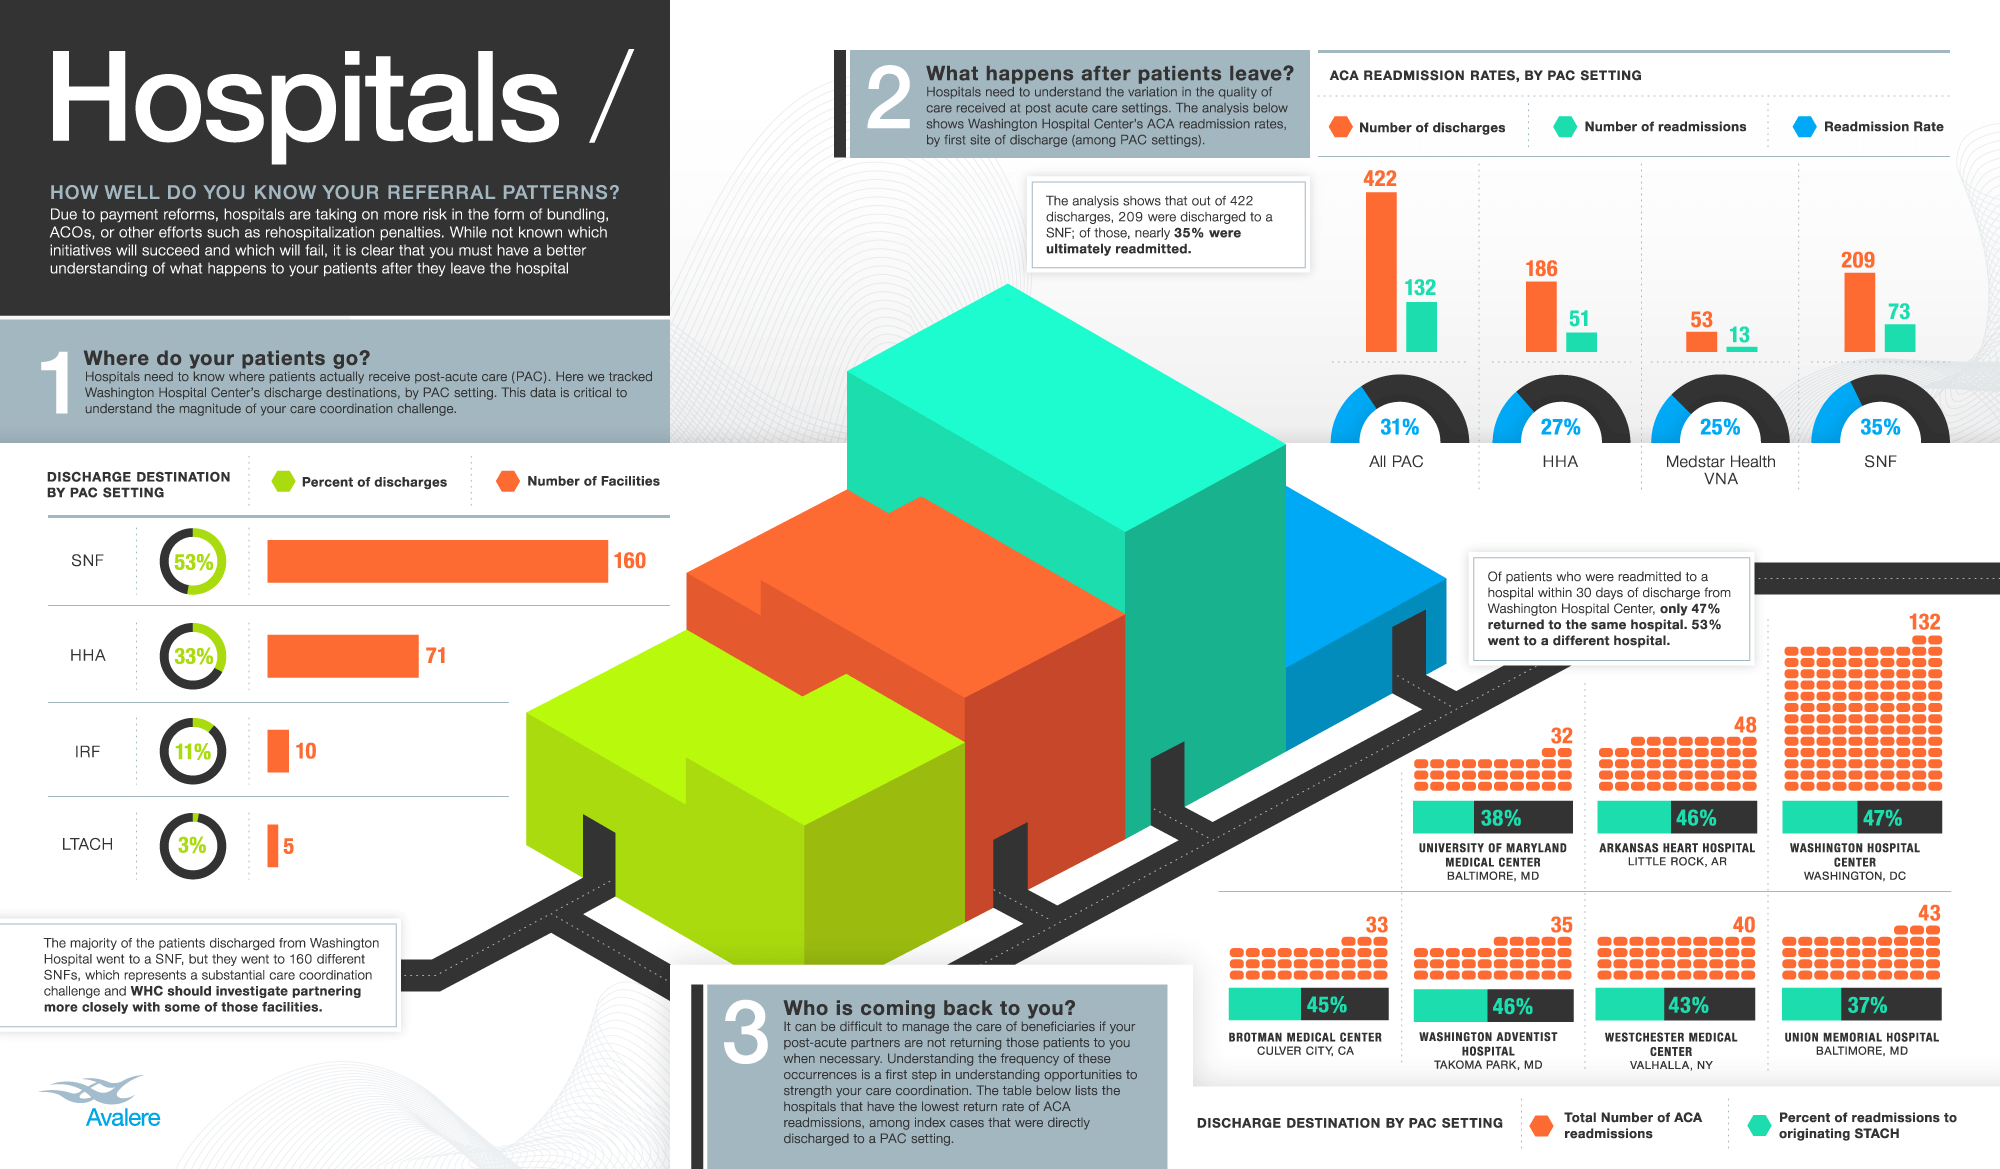
24) “Mobile Love” by Il Bureau 
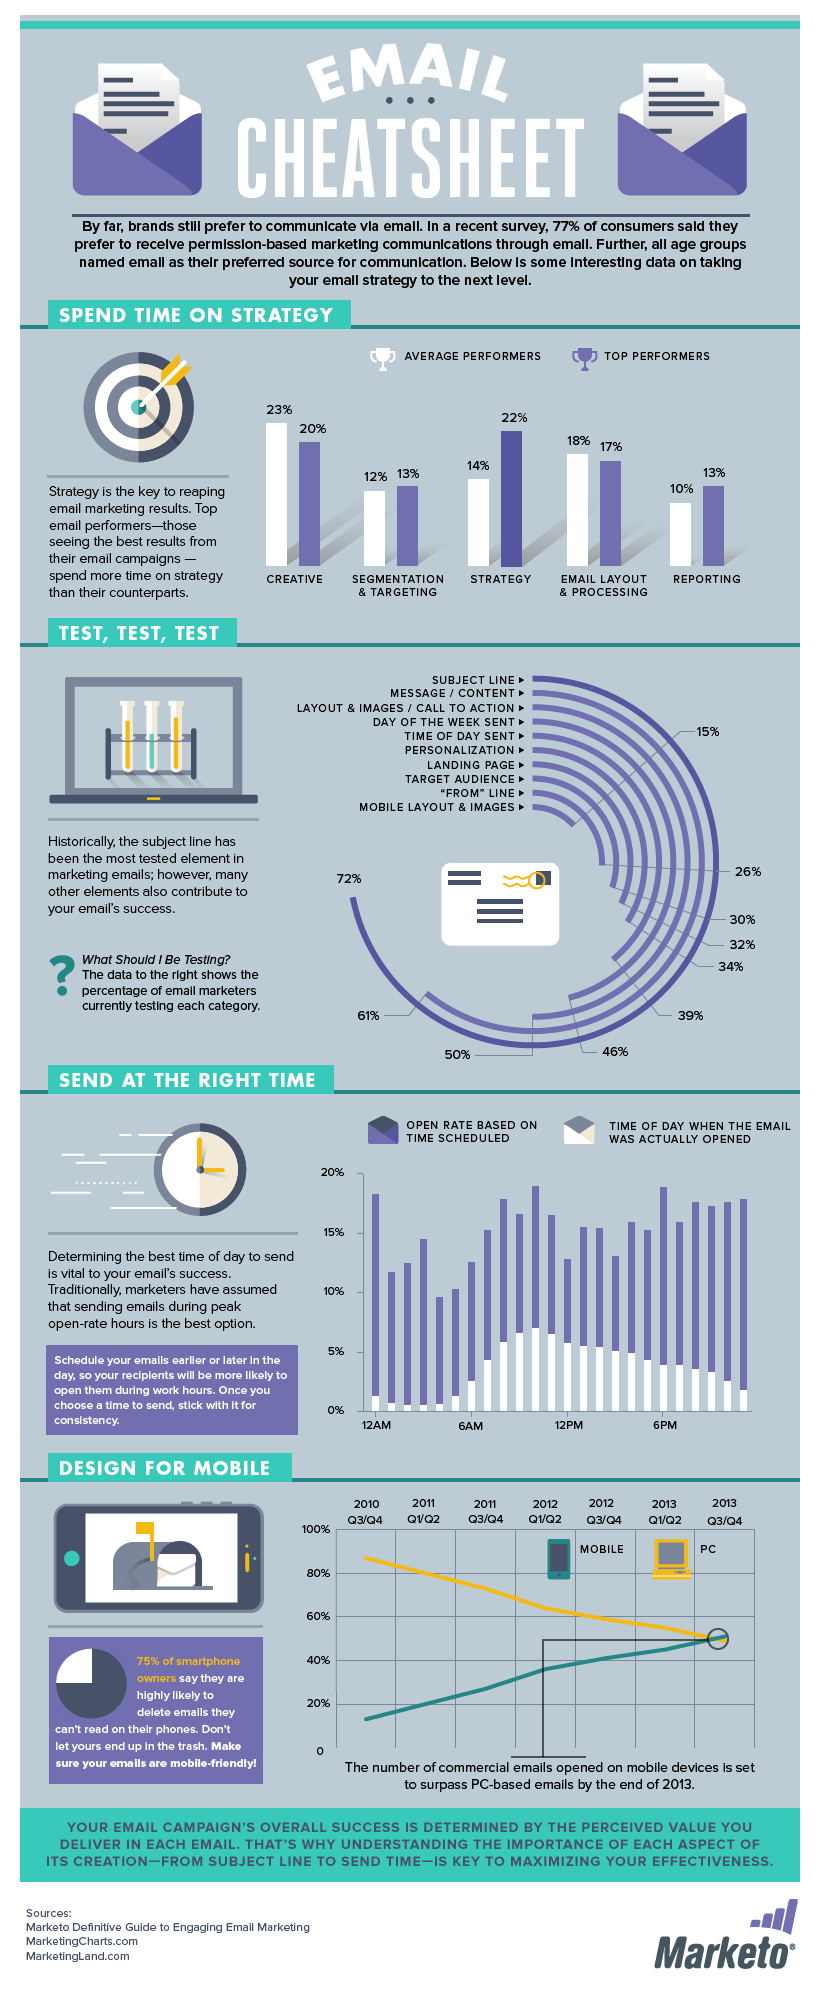 26) “Intelligency by Variety” by Kapow
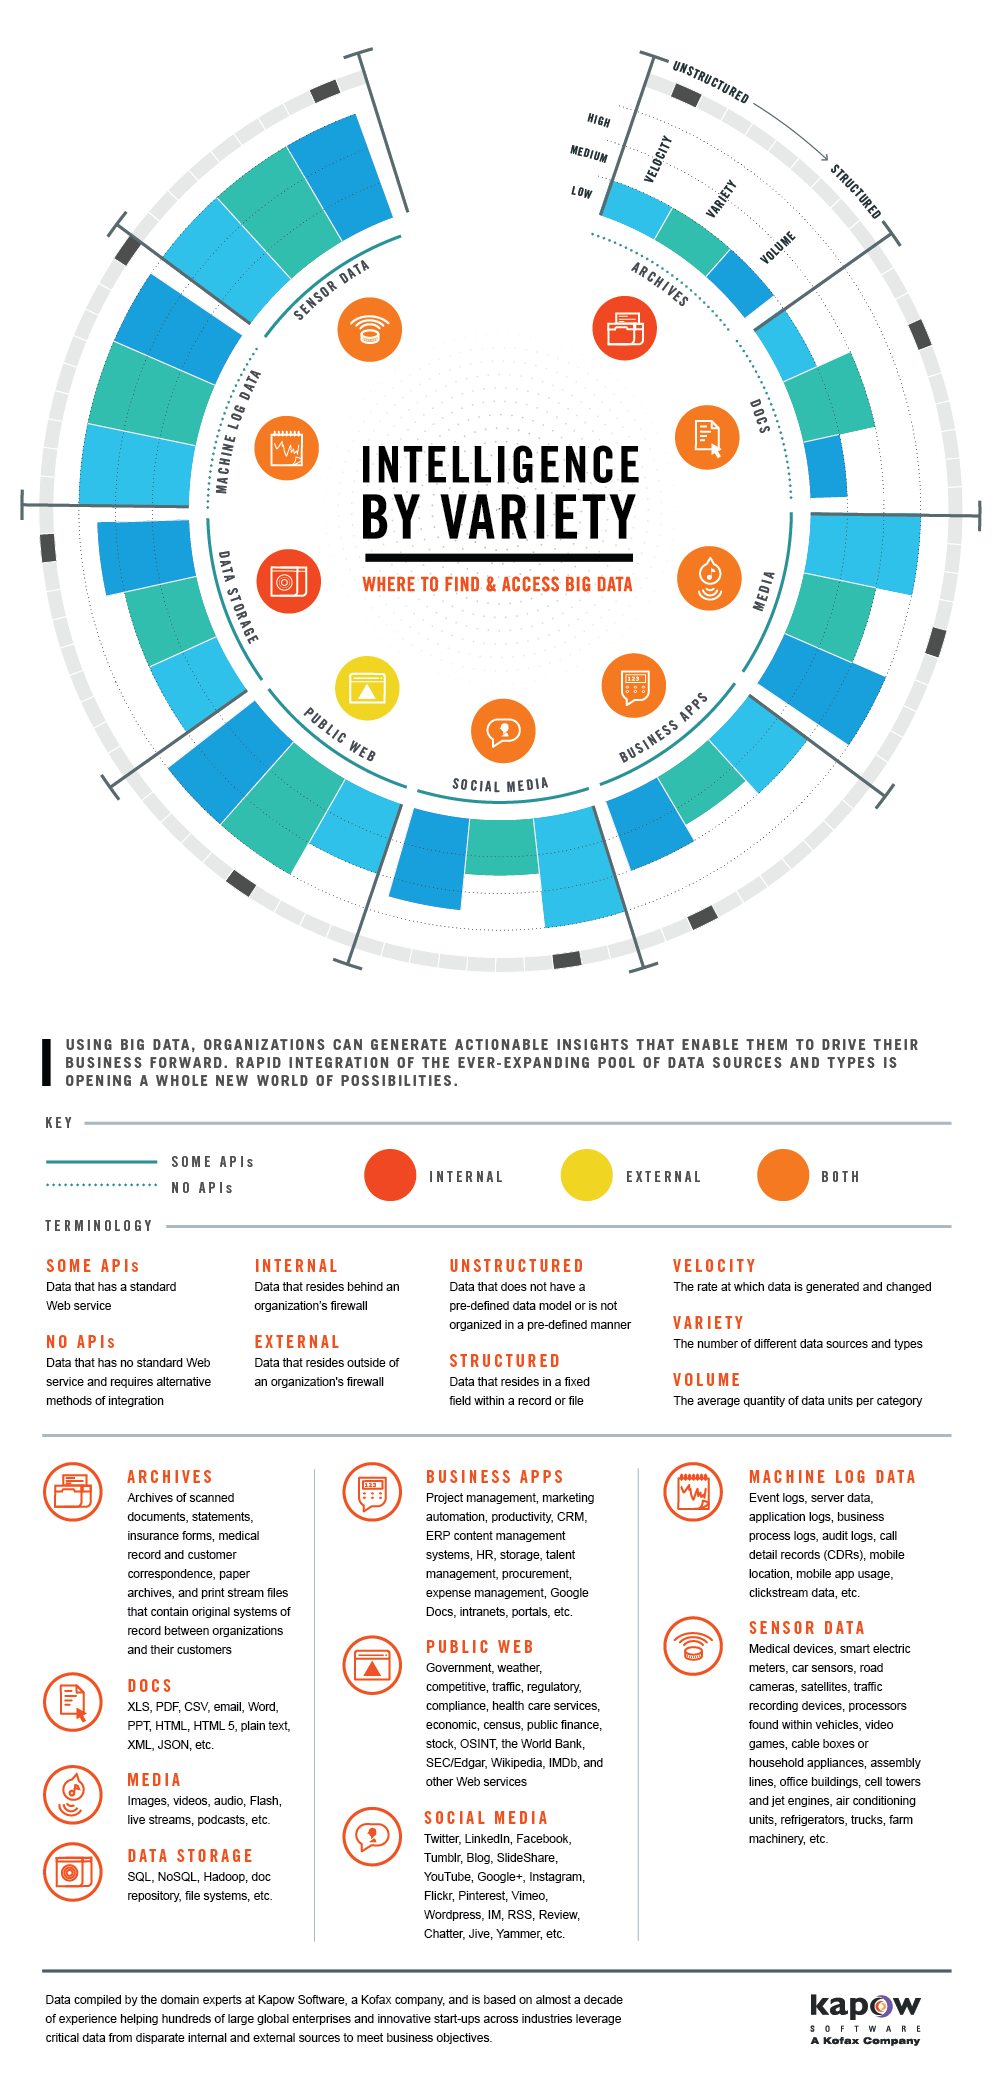
27) “Noob Guide to Online Marketing” by Unbounce 
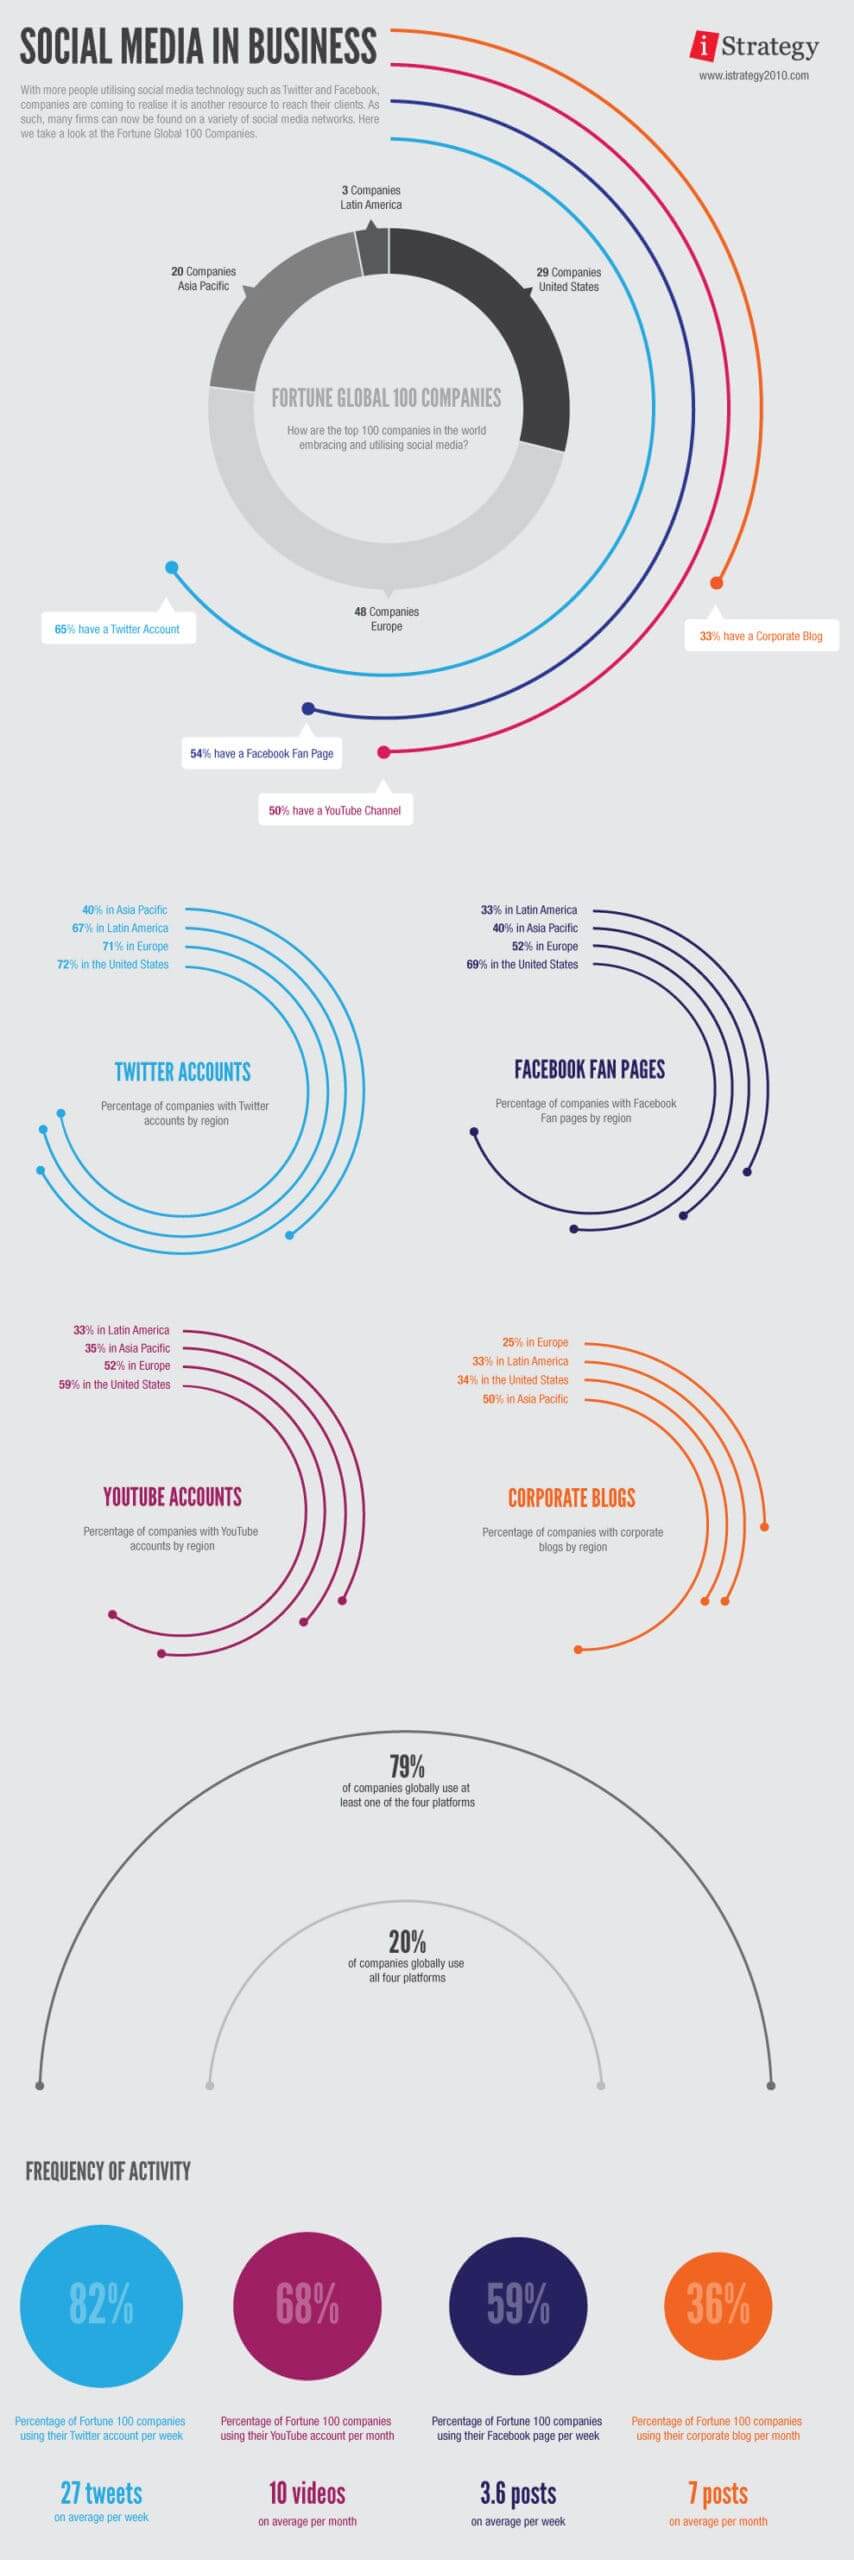
28) “Social Media in Business” by iStrategy
29) “Why Aren’t Brands Accessing Online Video Ads?” by BuySellAds 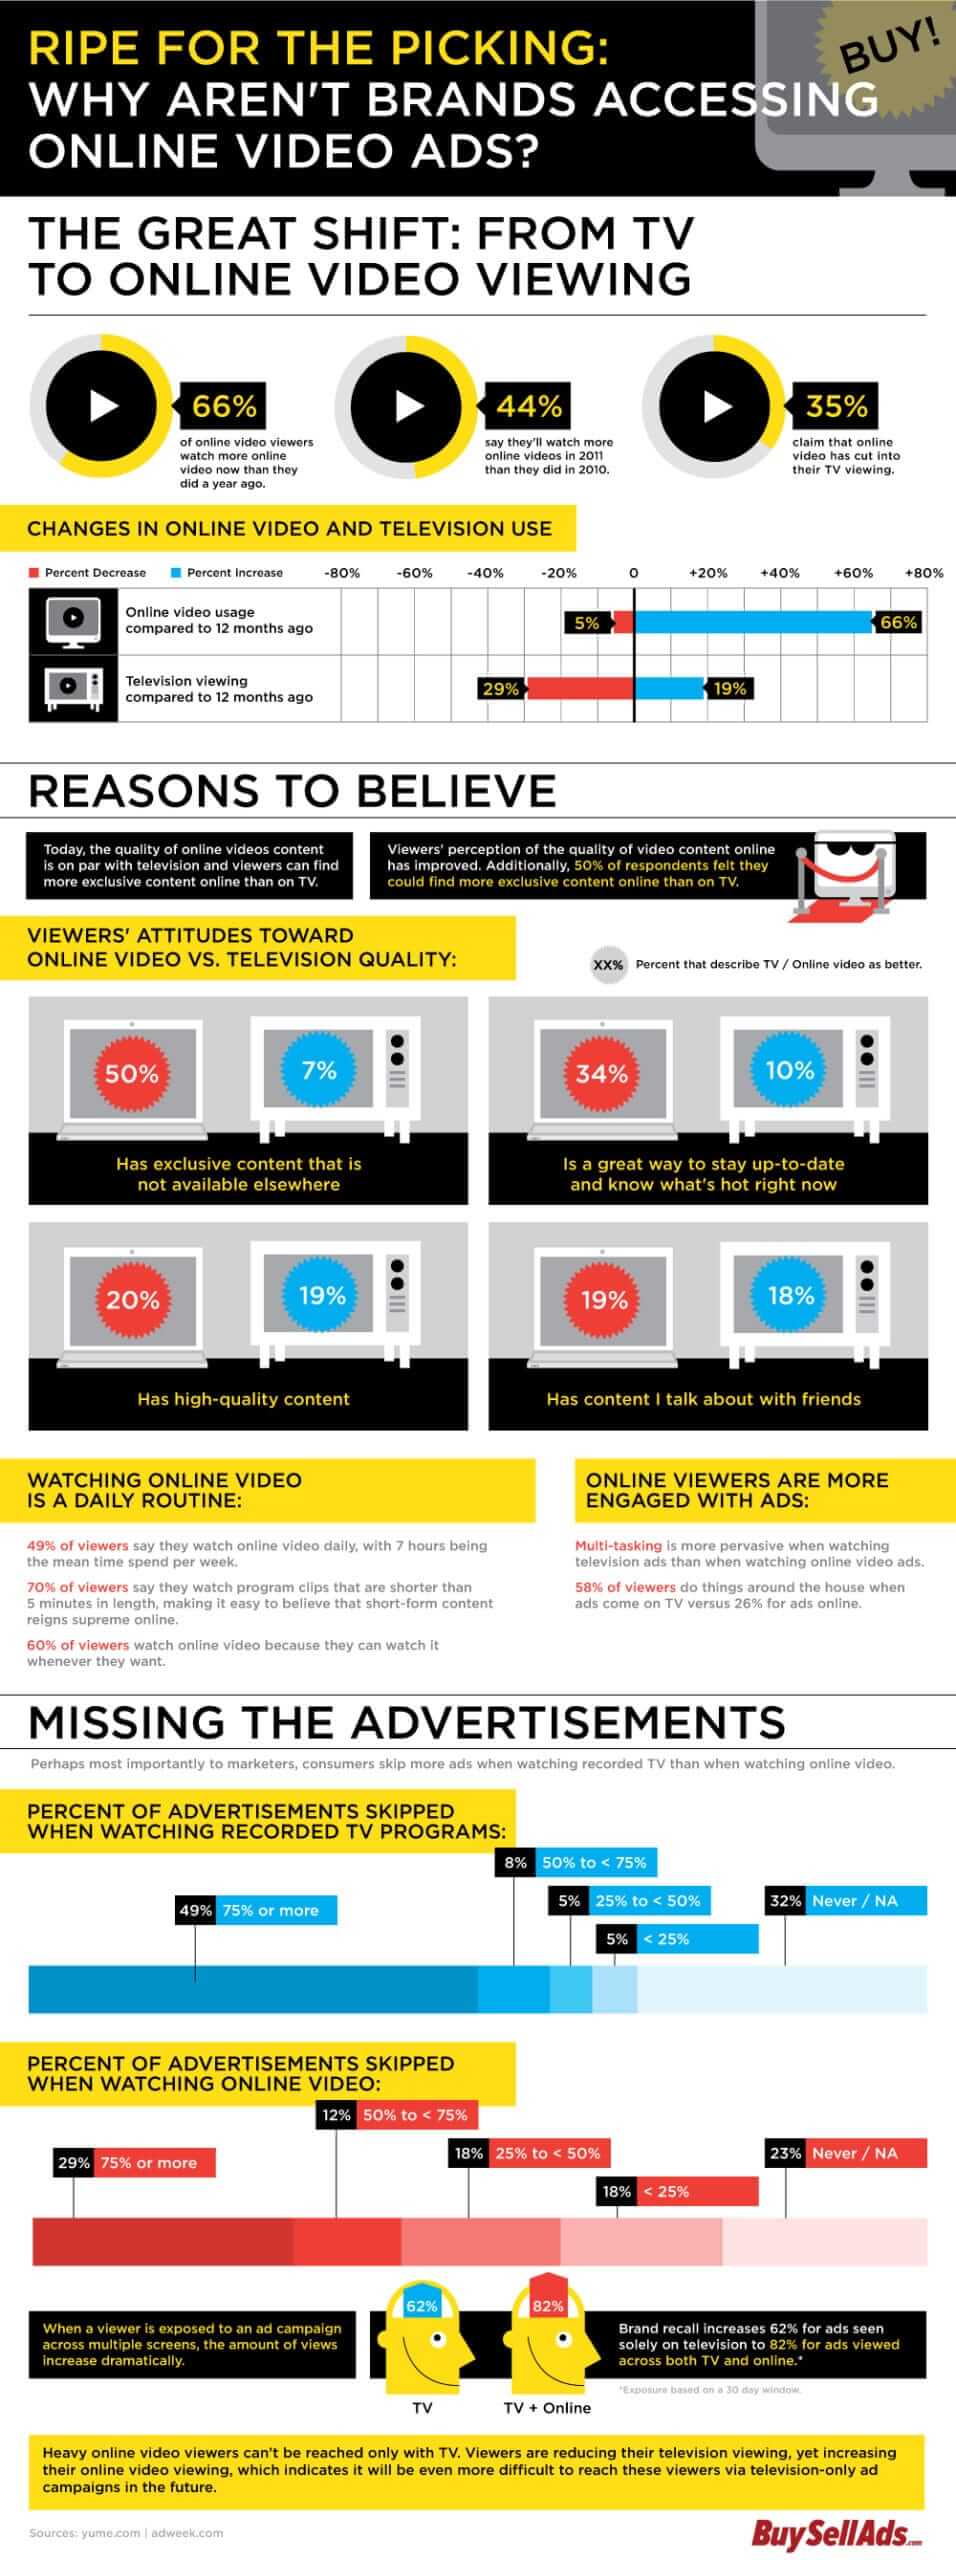
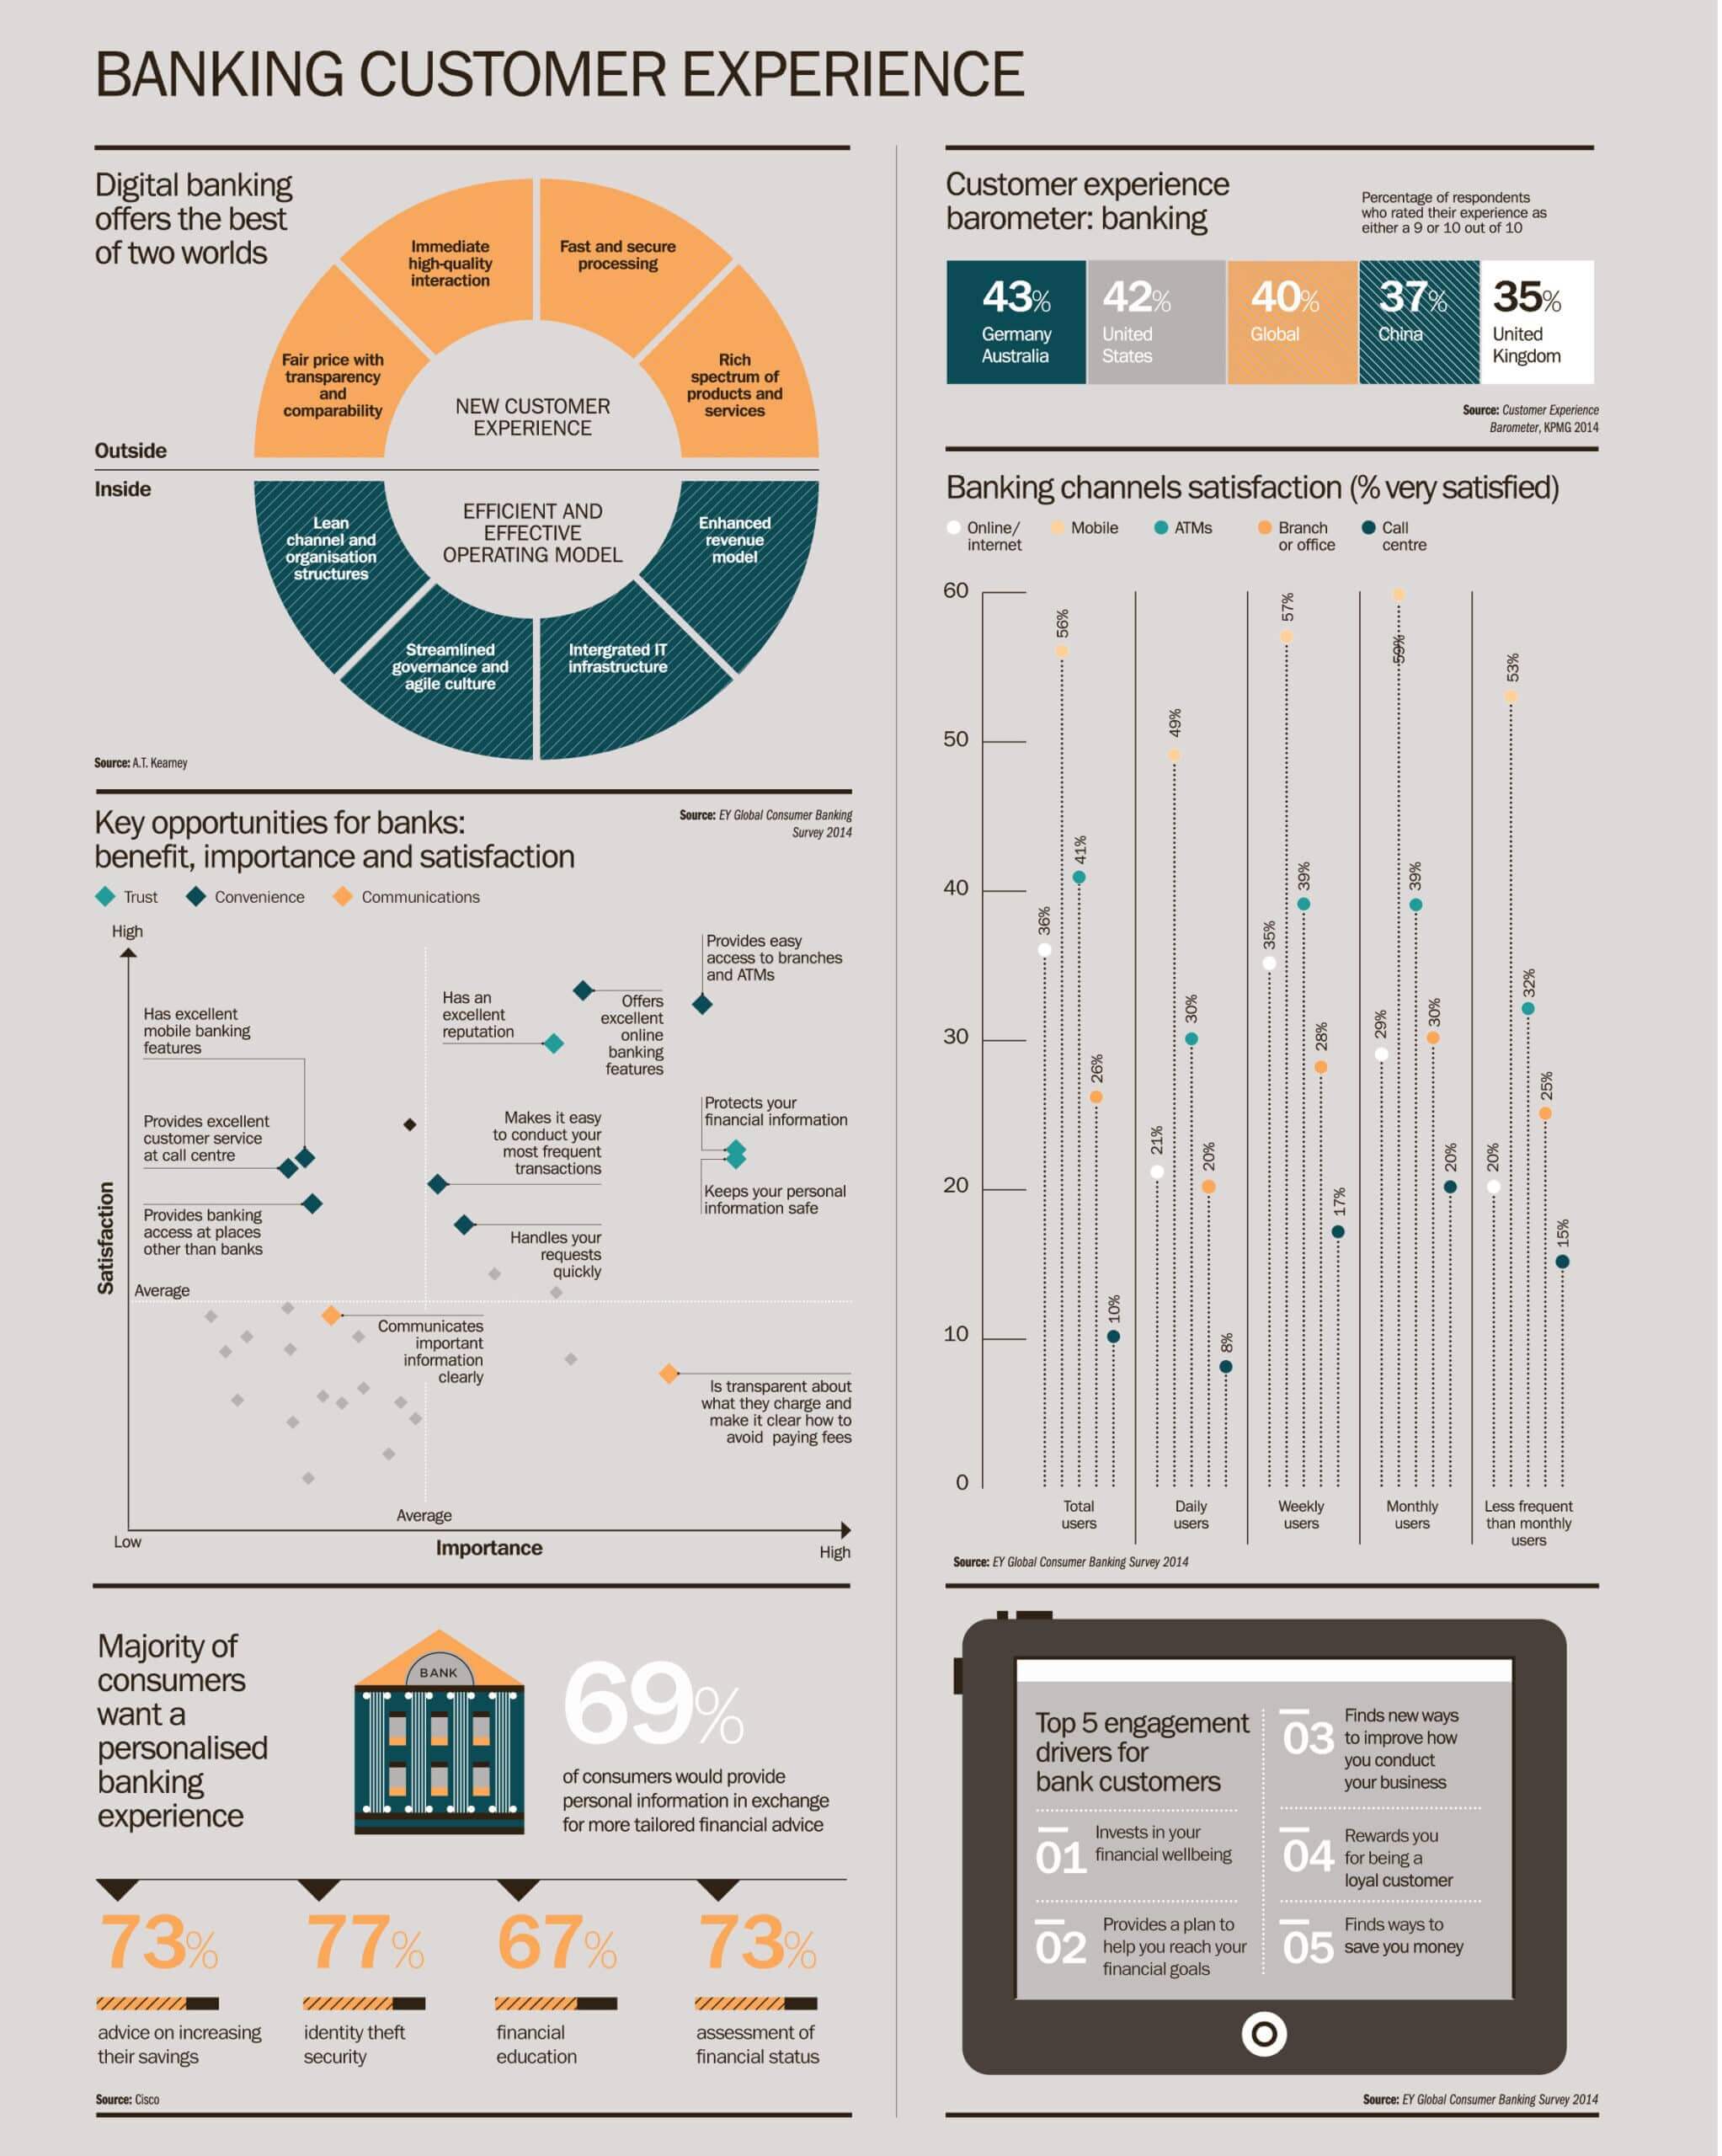
 31) “Banking Customer Experience” by Raconteur
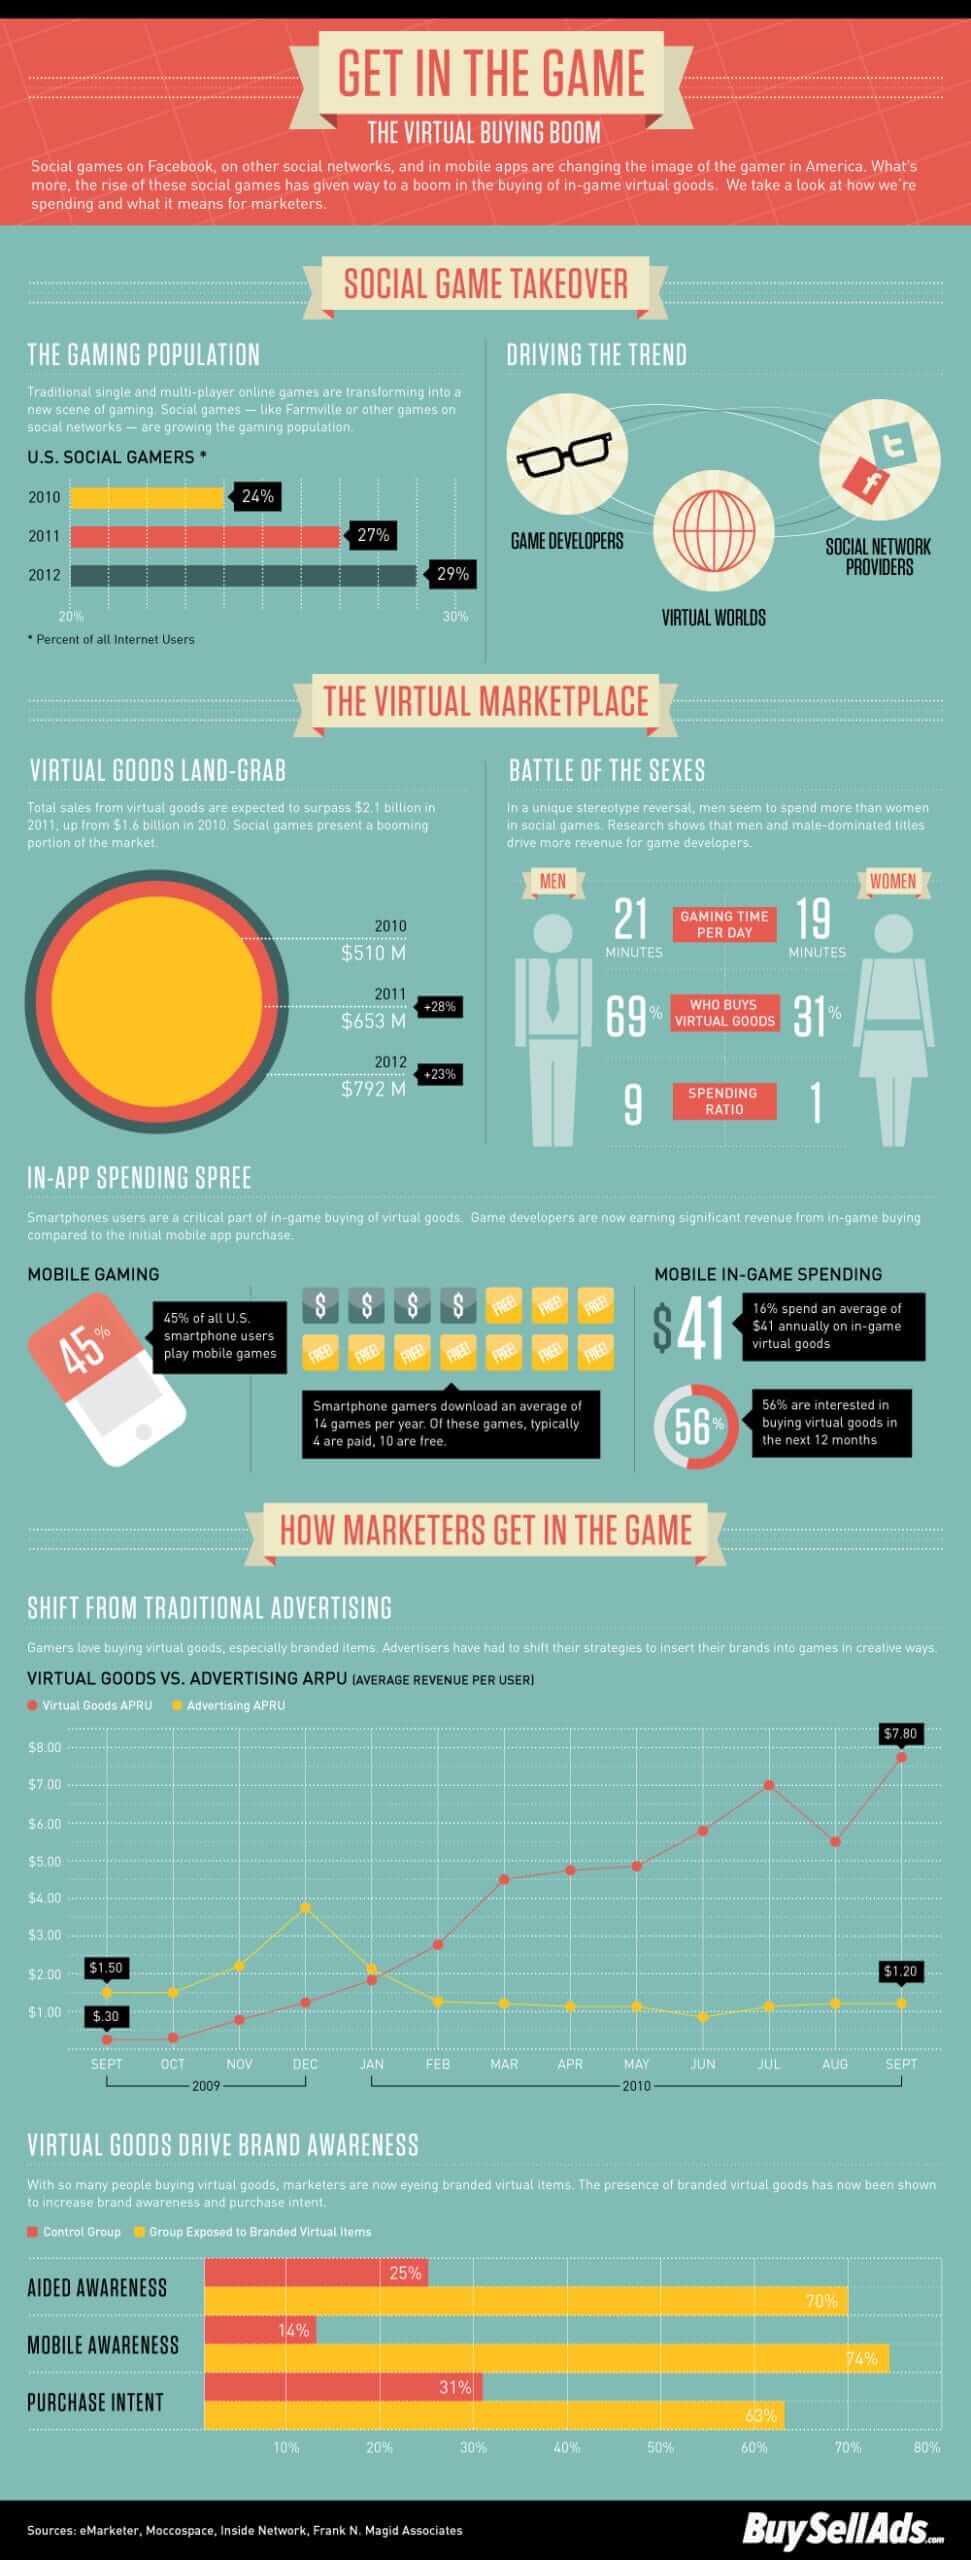
32) “The Virtual Buying Boom” by BuySellAds
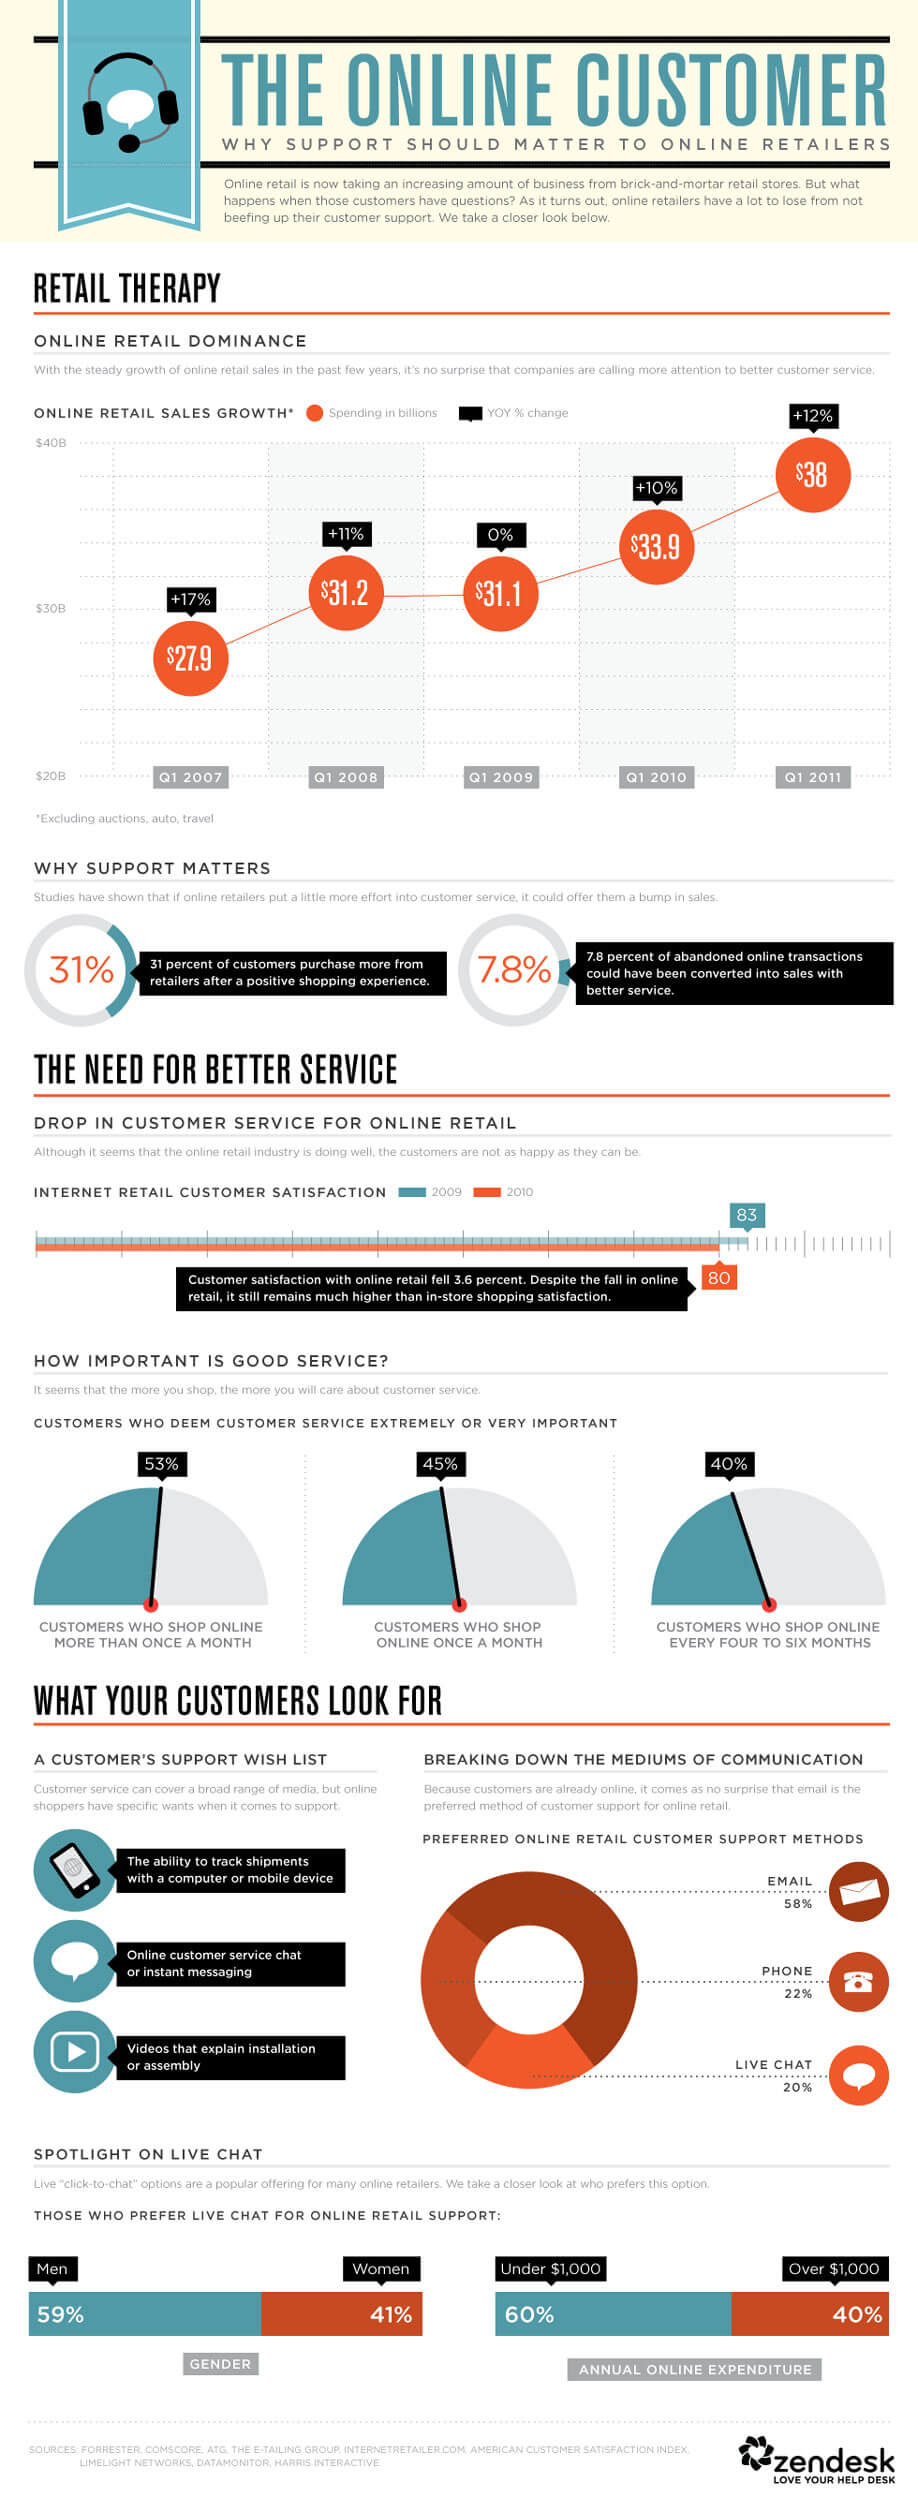
 33) “The Level Of Support Customers Expect From Online Retailers” by Zendesk
34) “When Should I Post This?” by Raka Creative
35) “Humanizing Big Data” by Alteryx
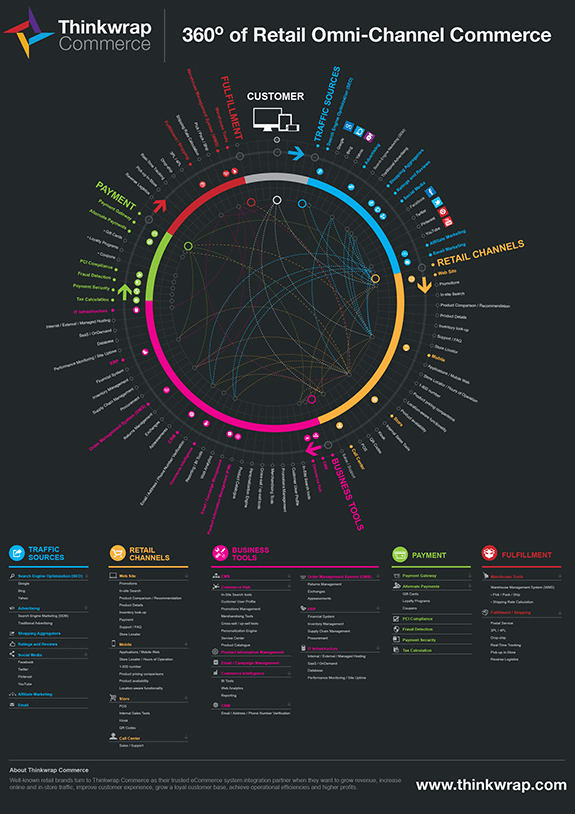 37) “Confidence Boost: Marketers Get More Savvy with Content Marketing” by LinkedIn
38) “Where’s the Value in Digital Marketing?” by Funnel Envy
 39) “Why Are People Afraid of E-Commerce?” by Site Jabber
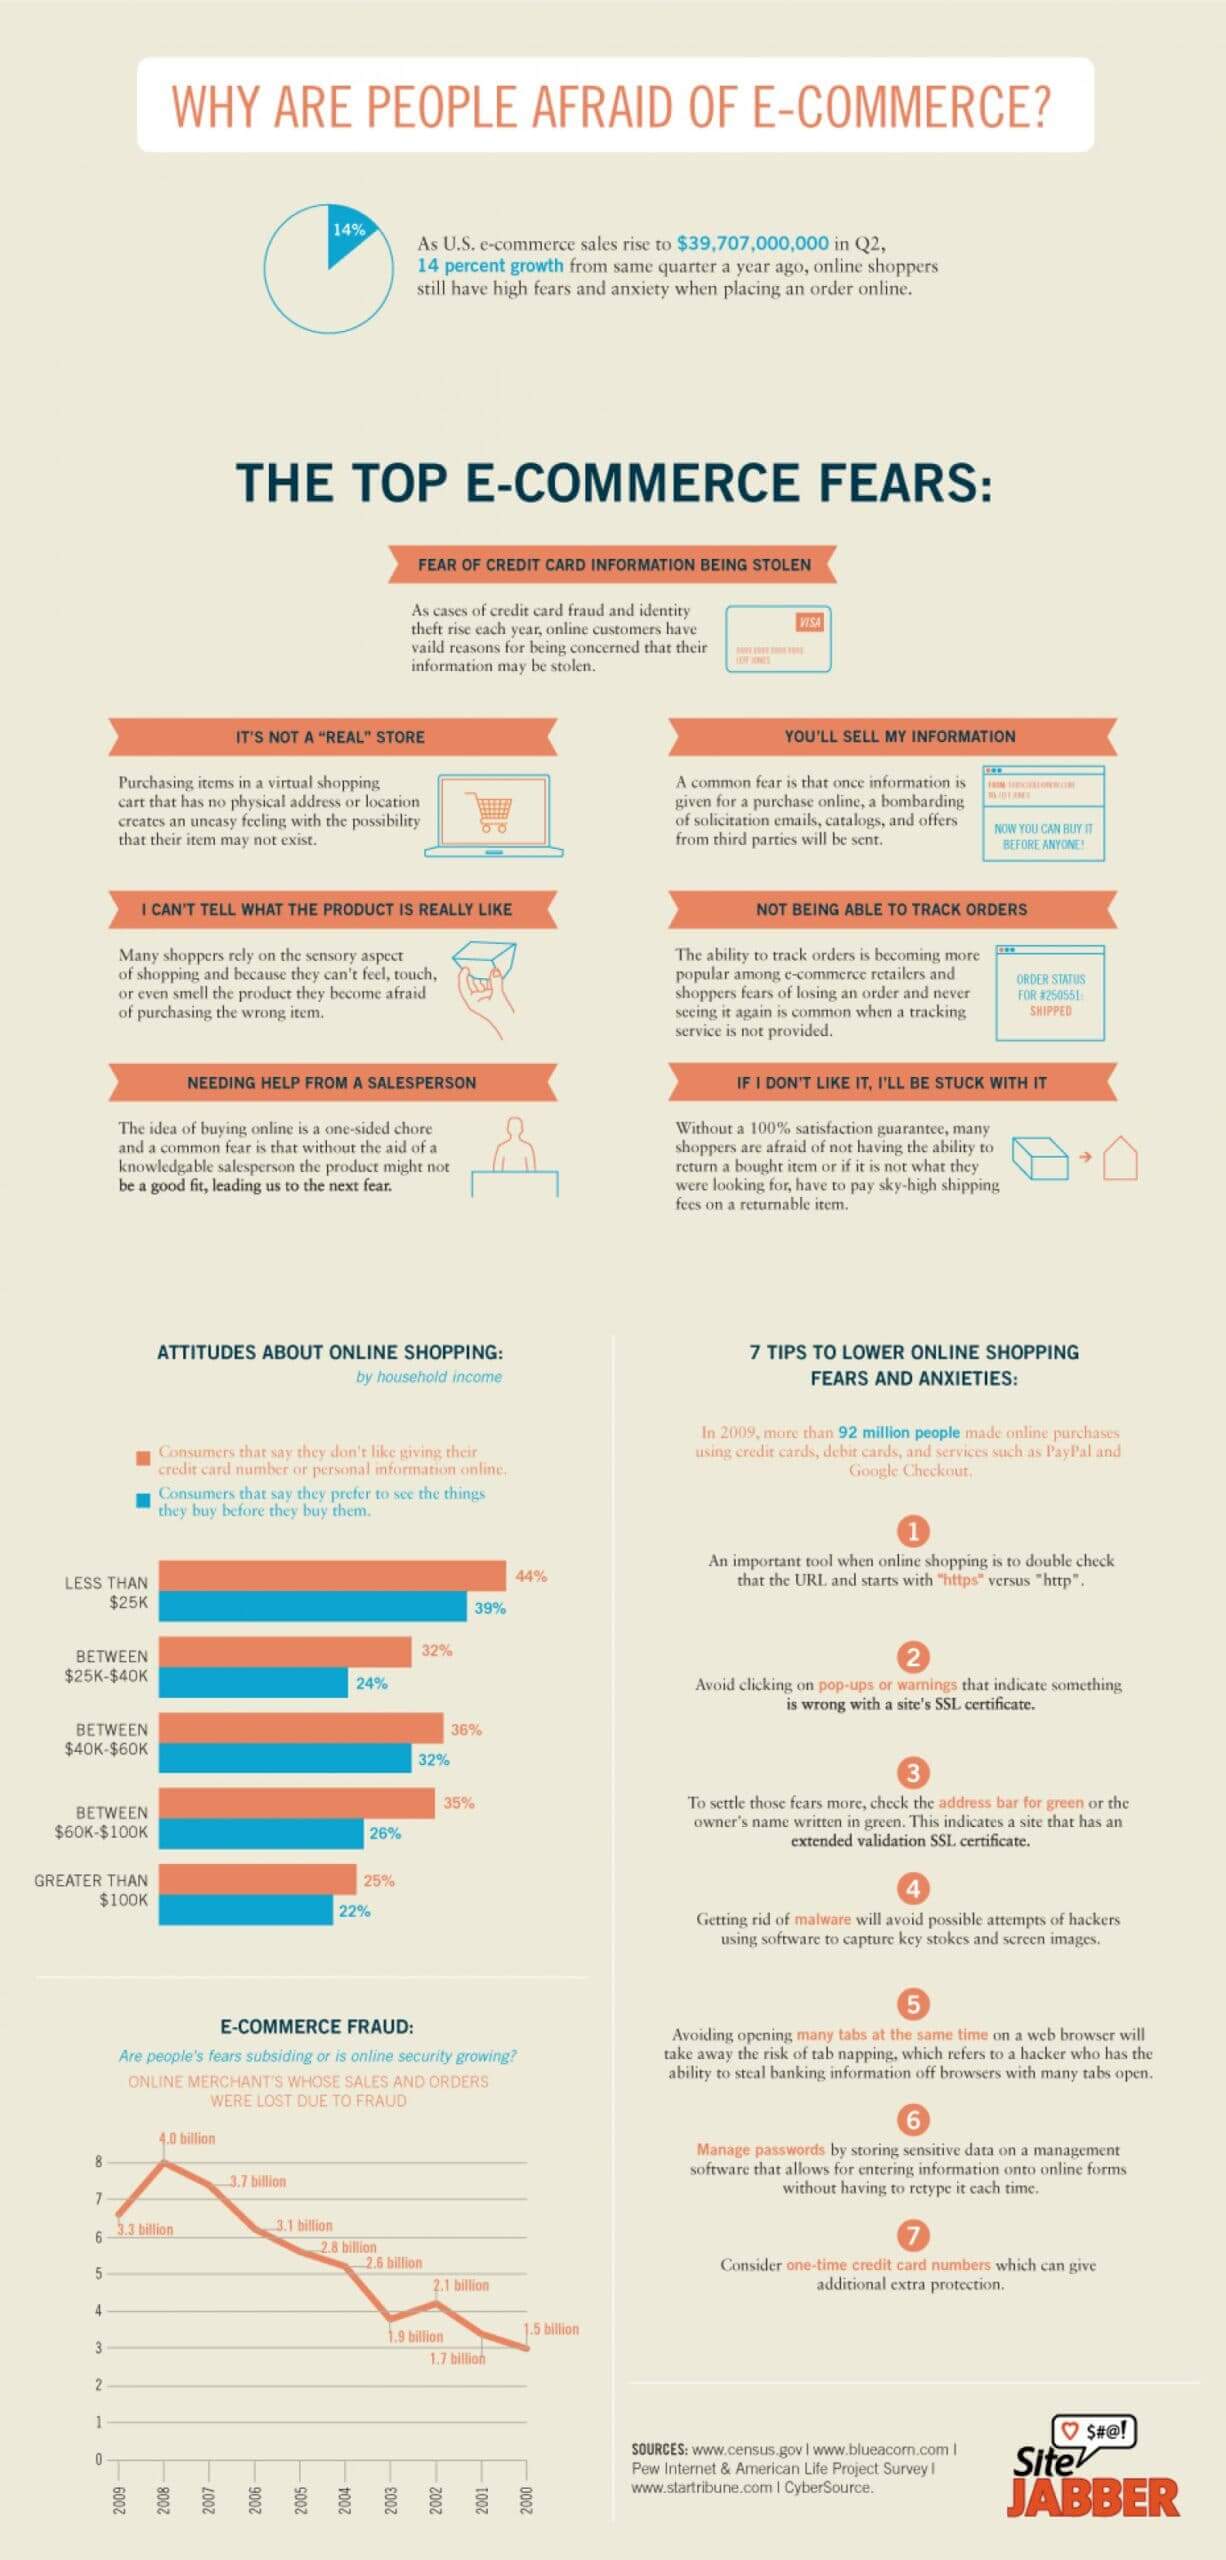
40) “5 Best Practices to Travel Management Success” by SAP
41) “What Really Fosters Innovation” by Mindjet 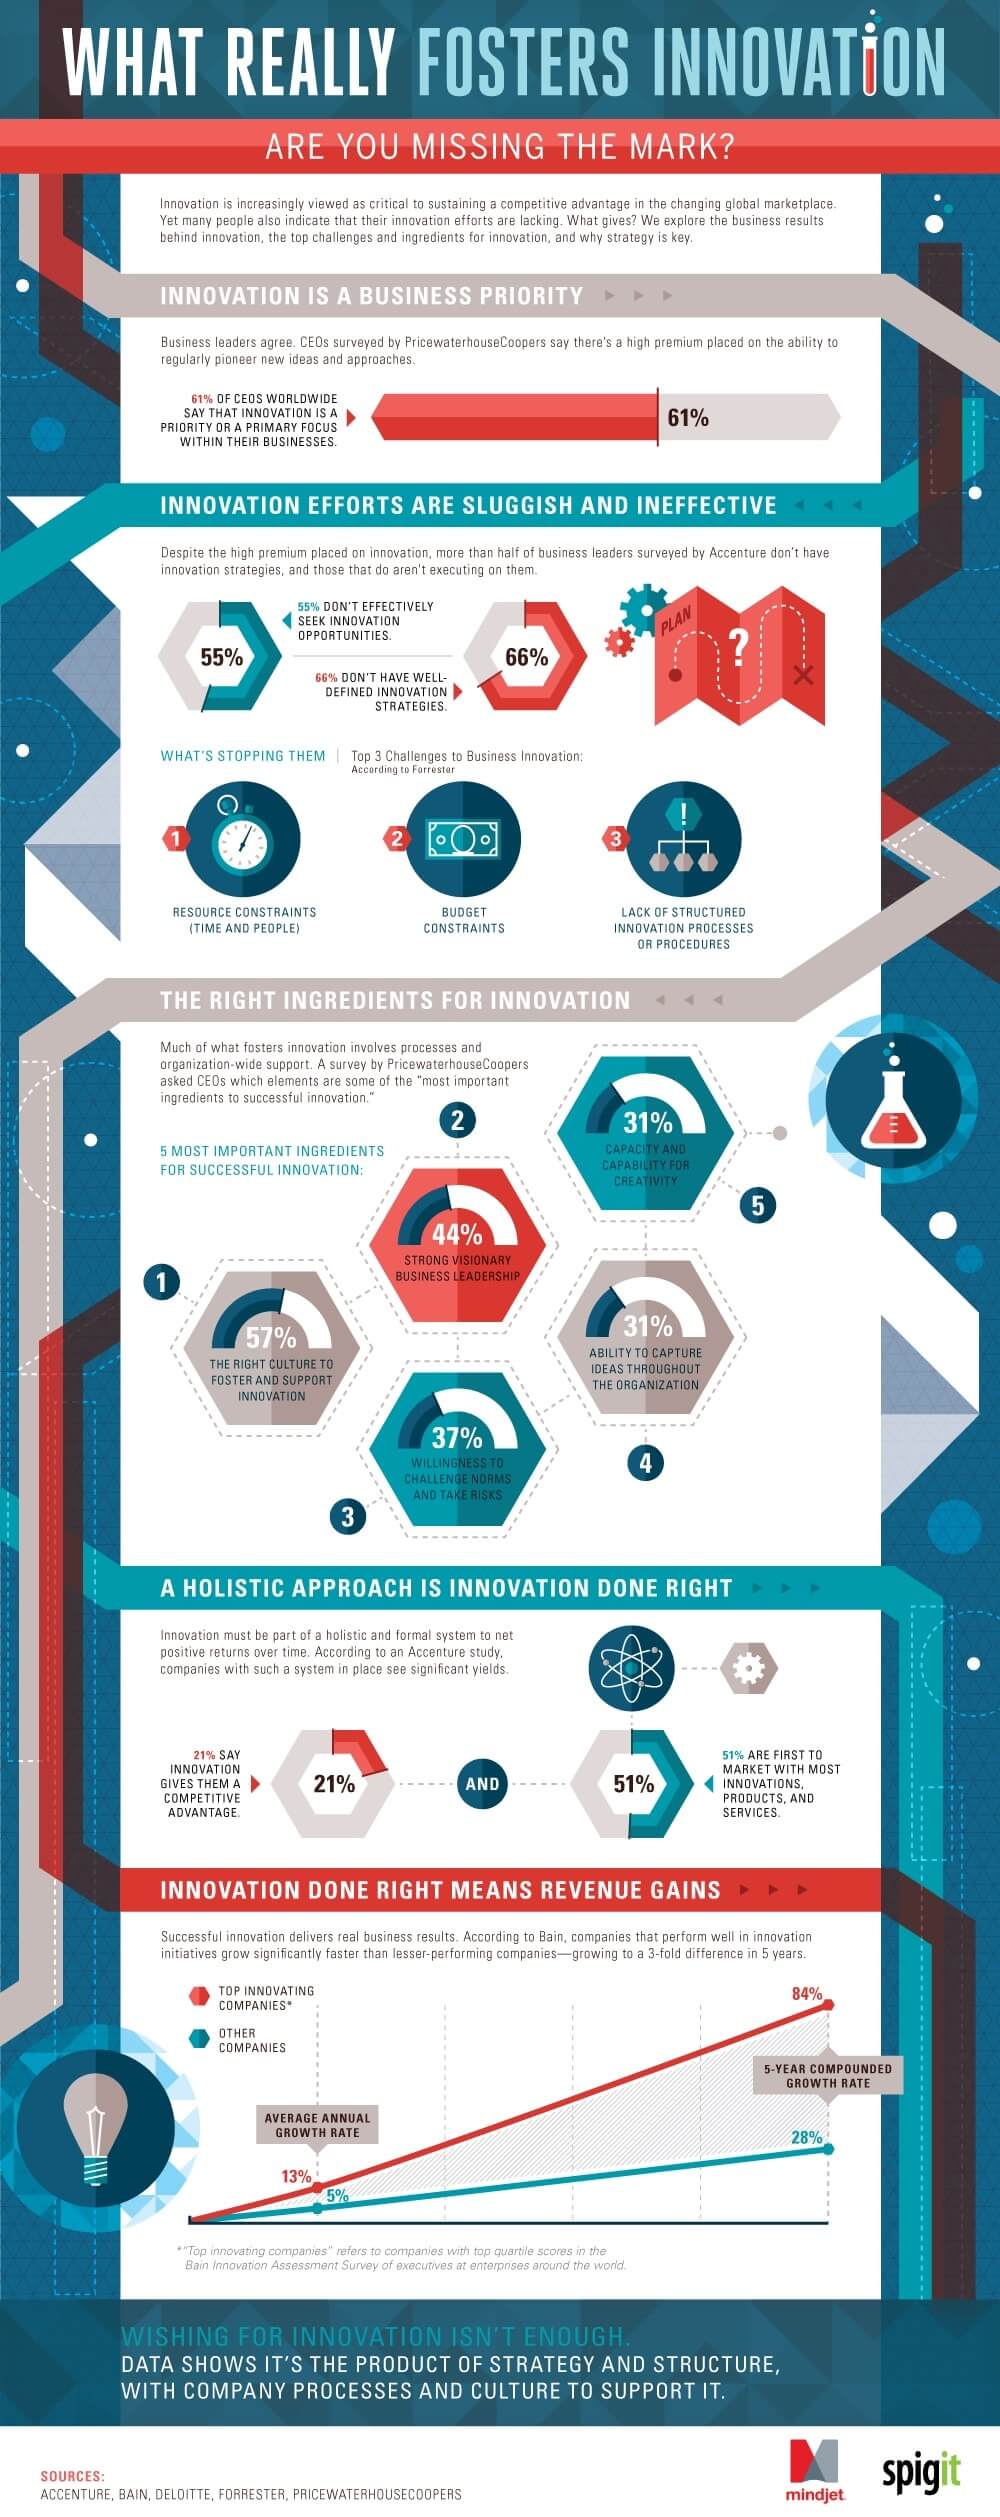
Information Design
Infographics are a fantastic way to communicate info, but they don’t always rely on data. Some depict other types of information, such as organizational structures or flow charts. More complicated charts can be a cluttered mess if done incorrectly, but these are perfect examples of logical flow and creative thinking.
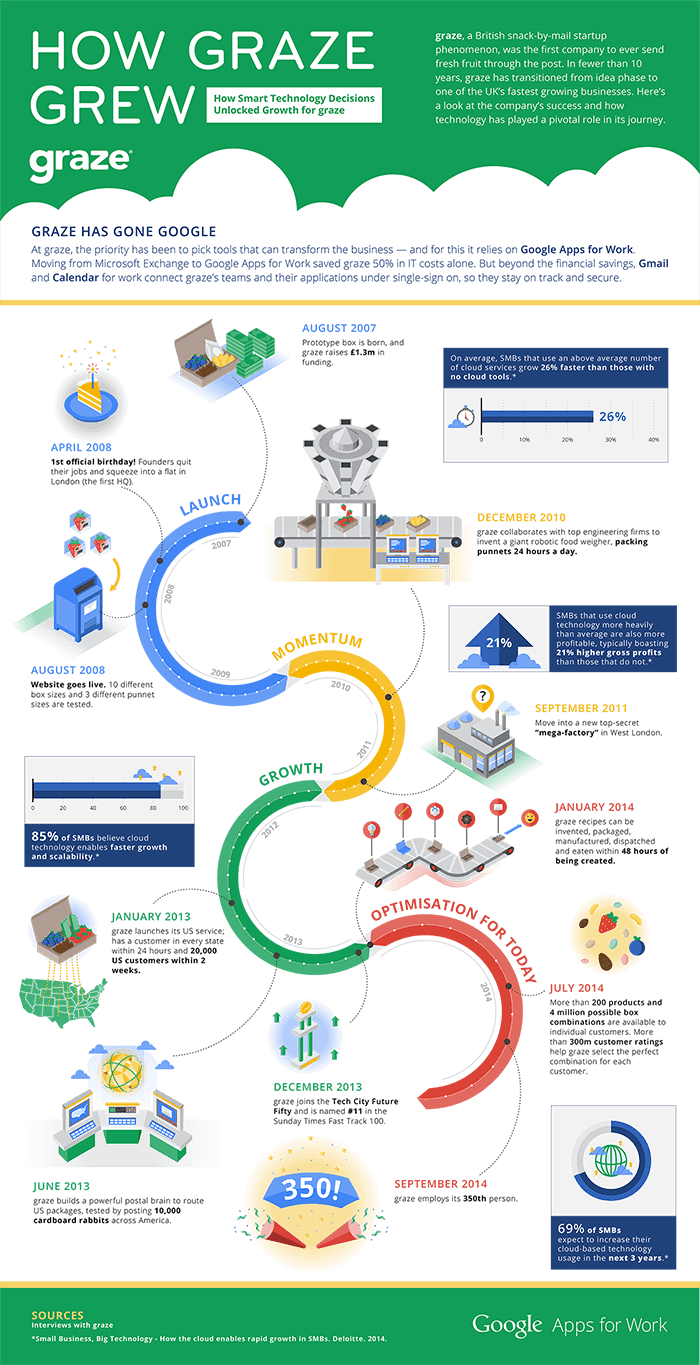
42) “How Graze Grew” by Google
43) “Creating Brand Recognition for your Small Business” by Cooperhouse 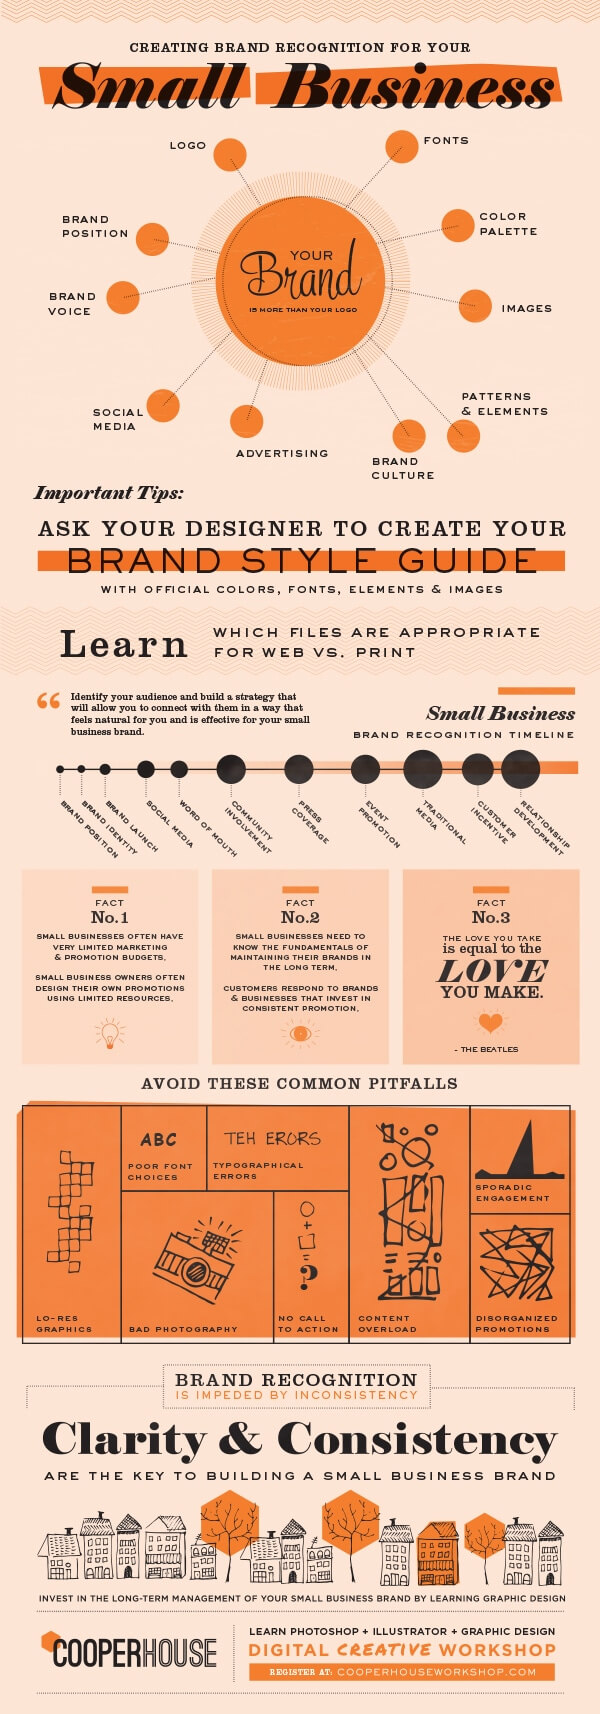
44) “A Logic Tree” by Sprint
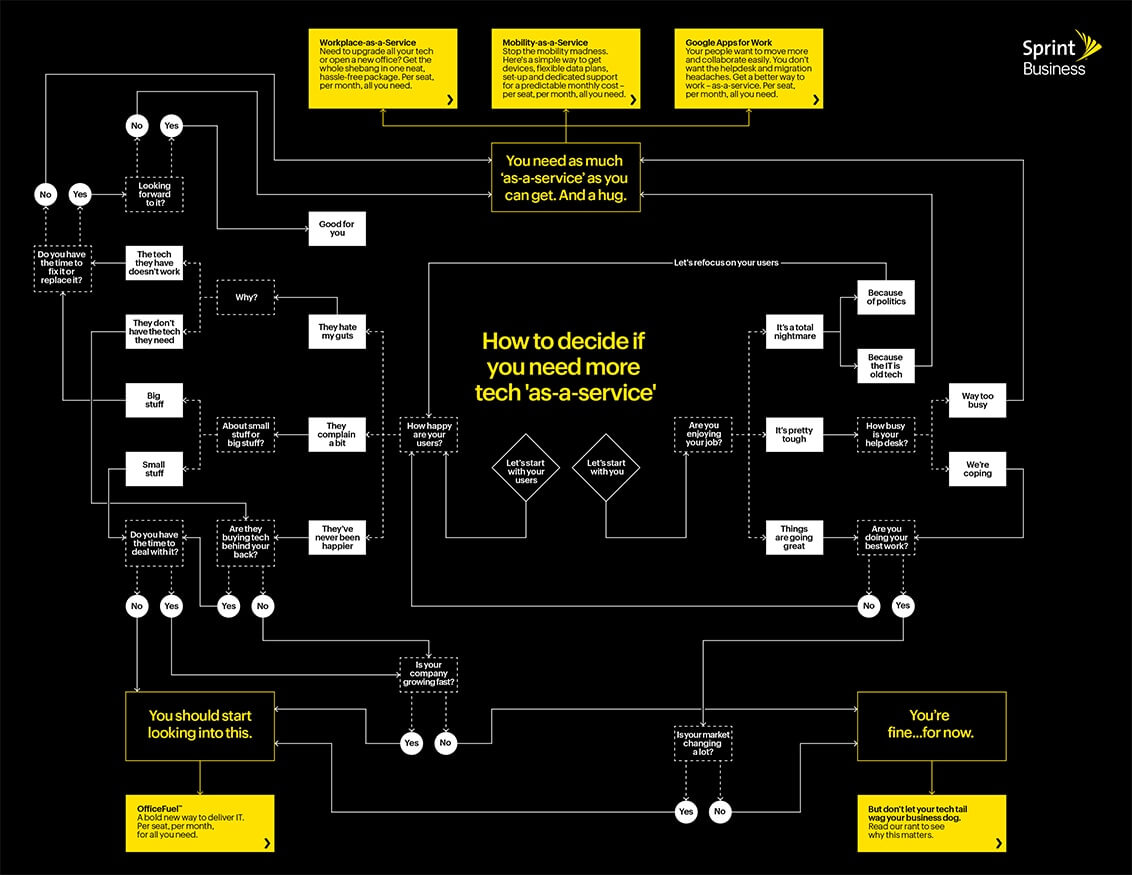 45) “What Type of Leader Are You?” by Headway Capital
  46) “Anatomy of the Perfect Banner Ad” by BuySellAds
47) “The Mixology of Content Marketing” by JBH 

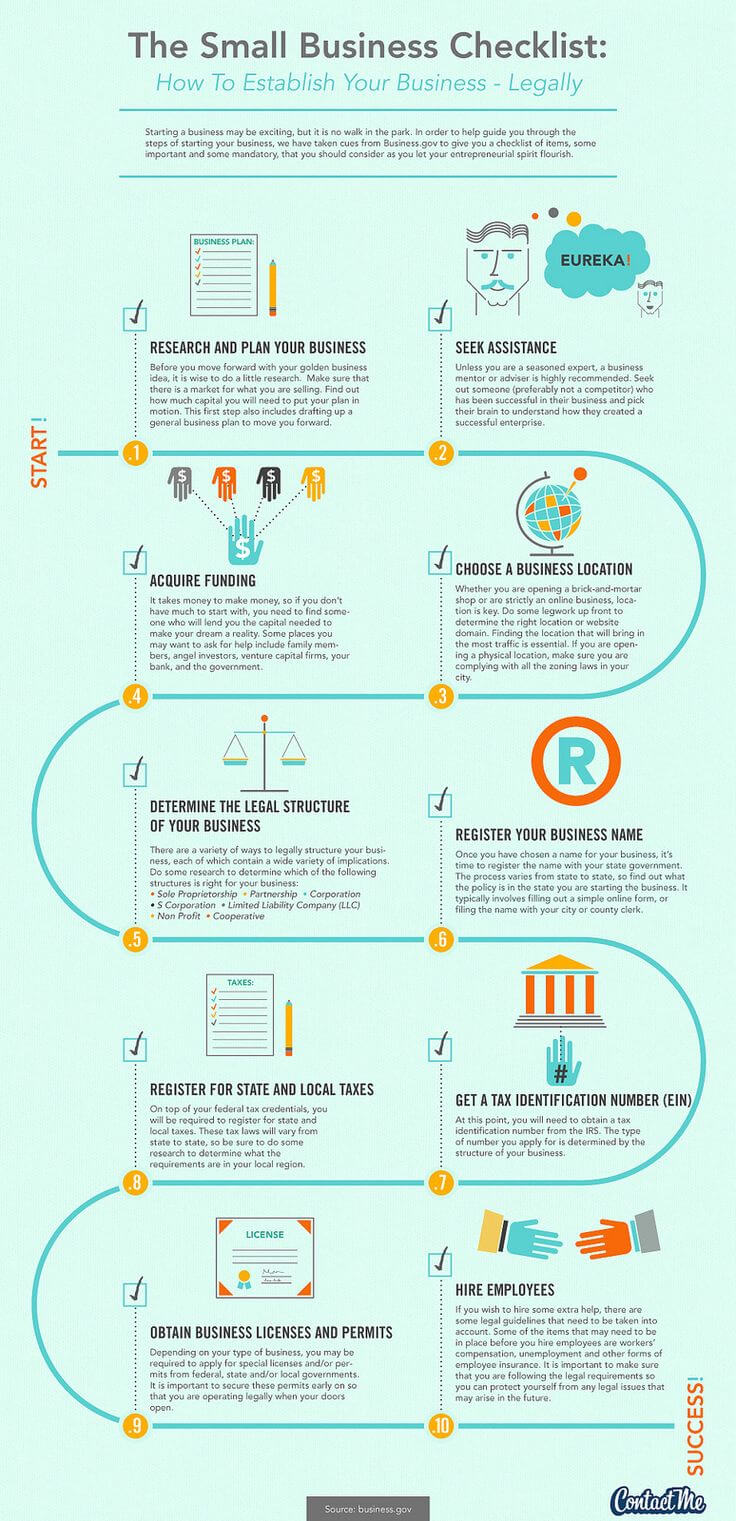
49) “The Small Business Checklist” by ContactME
50) “The Most important SAAS Metrics” By RJ Metrics

No matter what type of B2B infographics you’re creating, it’s important to follow best practices at every stage, from copywriting to distribution. For more tips on creating better infographics:
- See our complete guide to create infographics.
- Check out these 10 examples of minimal but effective infographic design.
- Ask these 10 questions before you hire an infographic design company.
- Find out how to fix the 15 most common infographic design mistakes.
- Learn how to optimize your B2B infographics for more traffic.
But if you still need a little help, we’re always happy to chat.


