With nearly a decade in the infographics game, we’ve seen the good, the bad, and the straight-up cringeworthy. But a truly beautiful infographic can still stop us in our tracks. This year gave us many of those moments, as designers worldwide expressed their creativity in various ways.
As we close out 2016, we’re sharing a roundup of some of our infographic design examples. We hope this brings you plenty of inspiration for your own infographics next year.

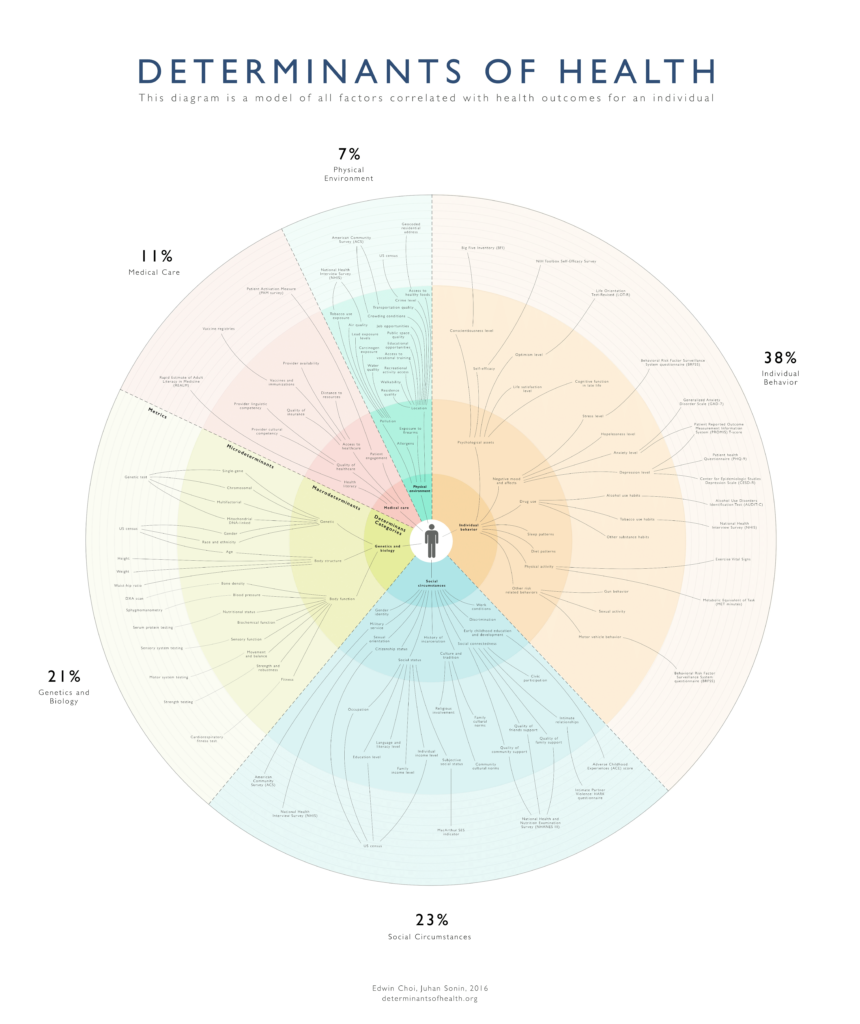
1. Determinants of Health by Involution Studios
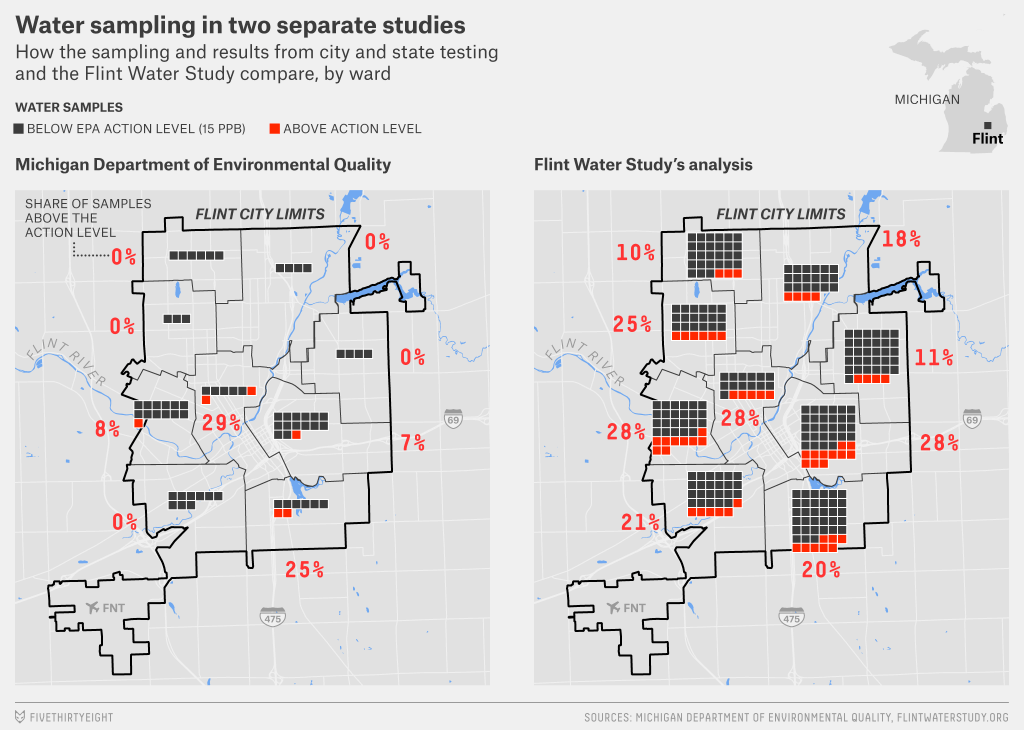
2. What Went Wrong in Flint by FiveThirtyEight
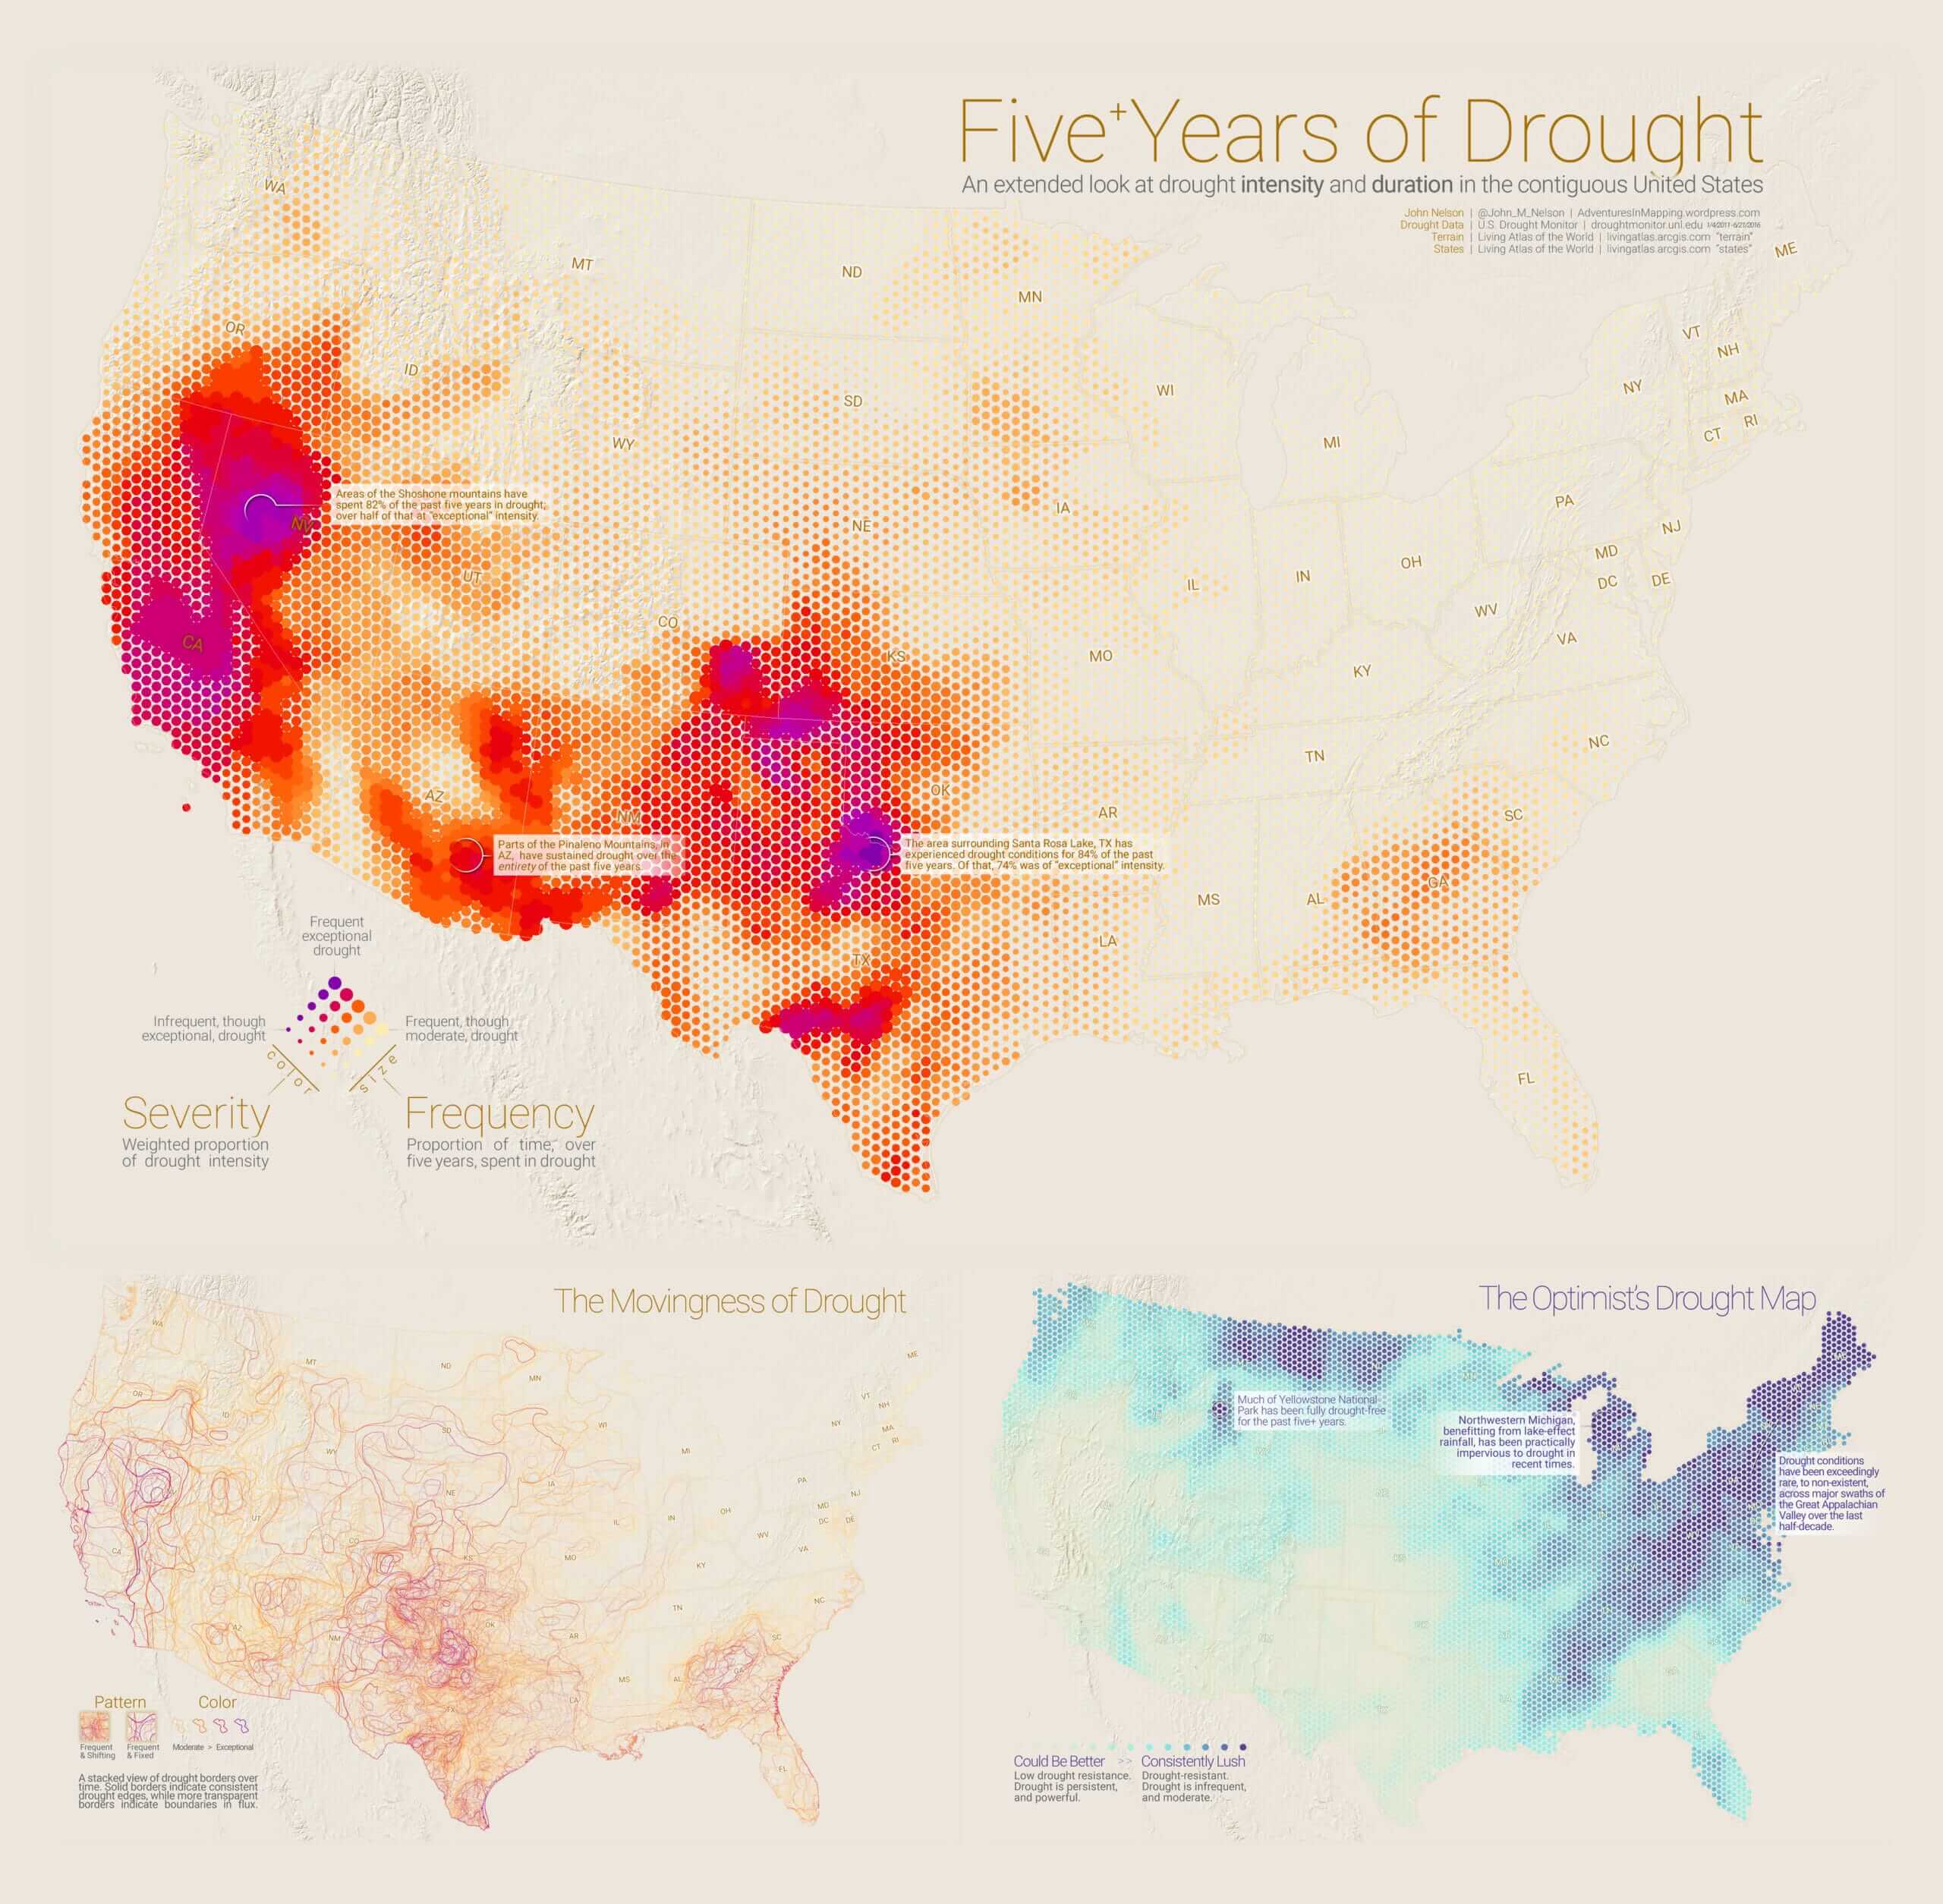
3. Five Years of Drought by John Nelson
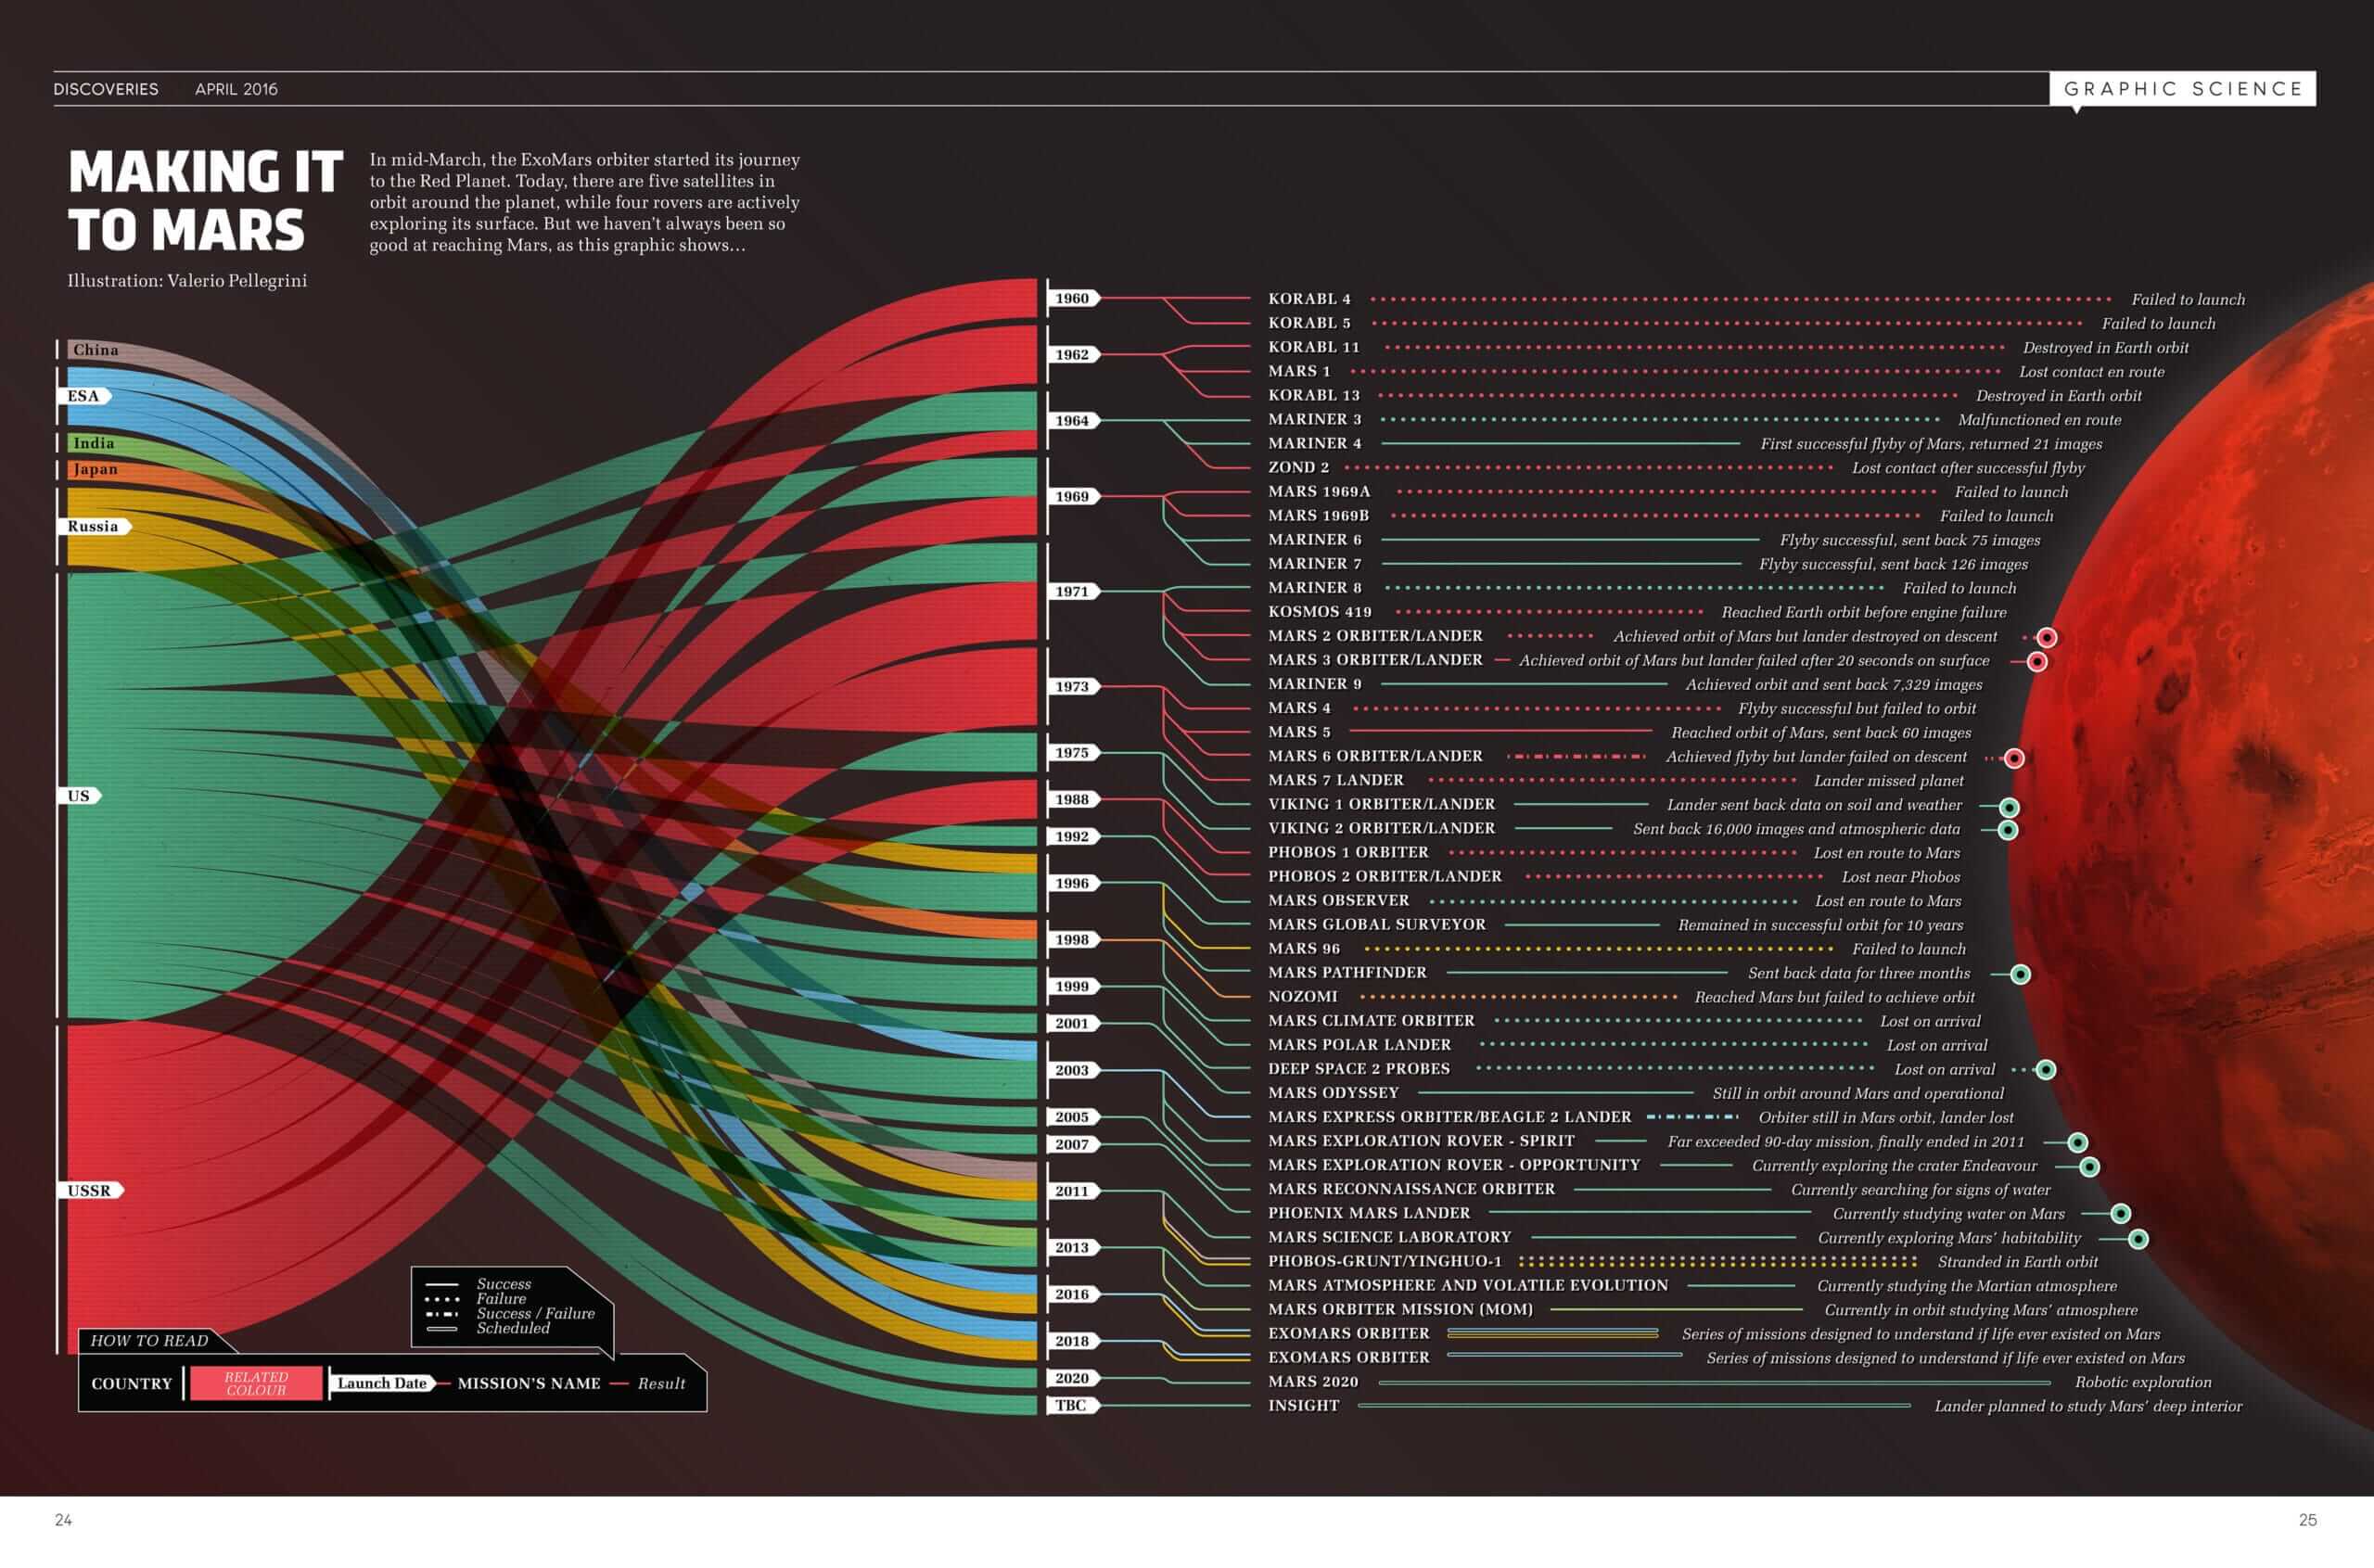
4. Making it to Mars by Valerio Pellegrini
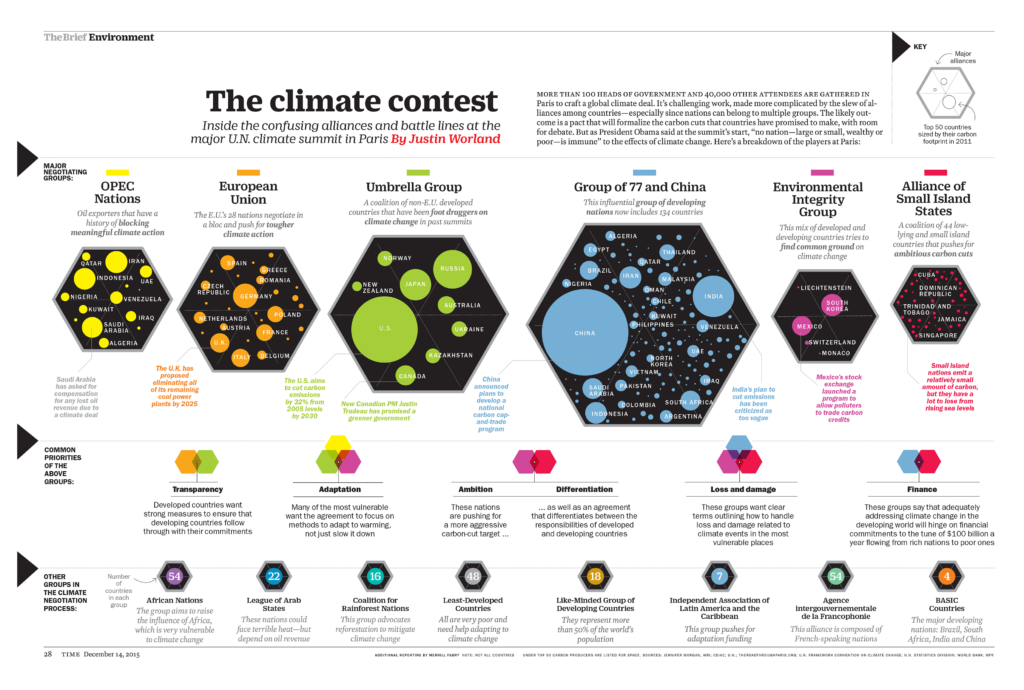
5. The Climate Contest by Justin Worland
6. All The Pretty Horses by Column Five

7. Garbage Sorting by Pei Lei Ye

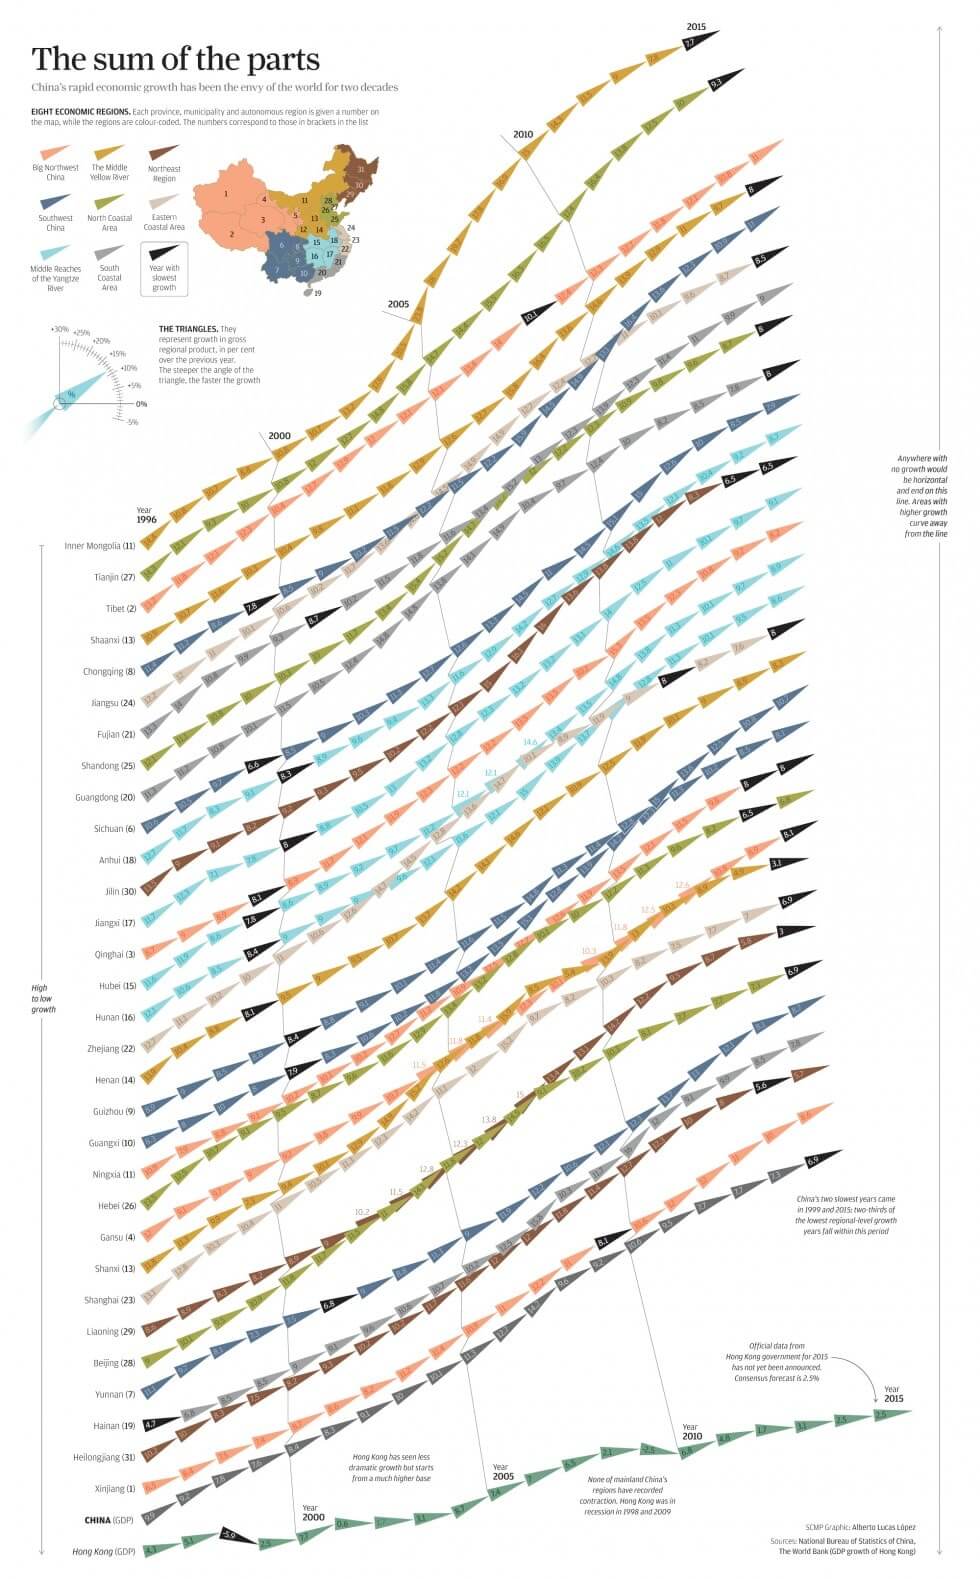
8. The Sum of the Parts by Alberto Lucas López
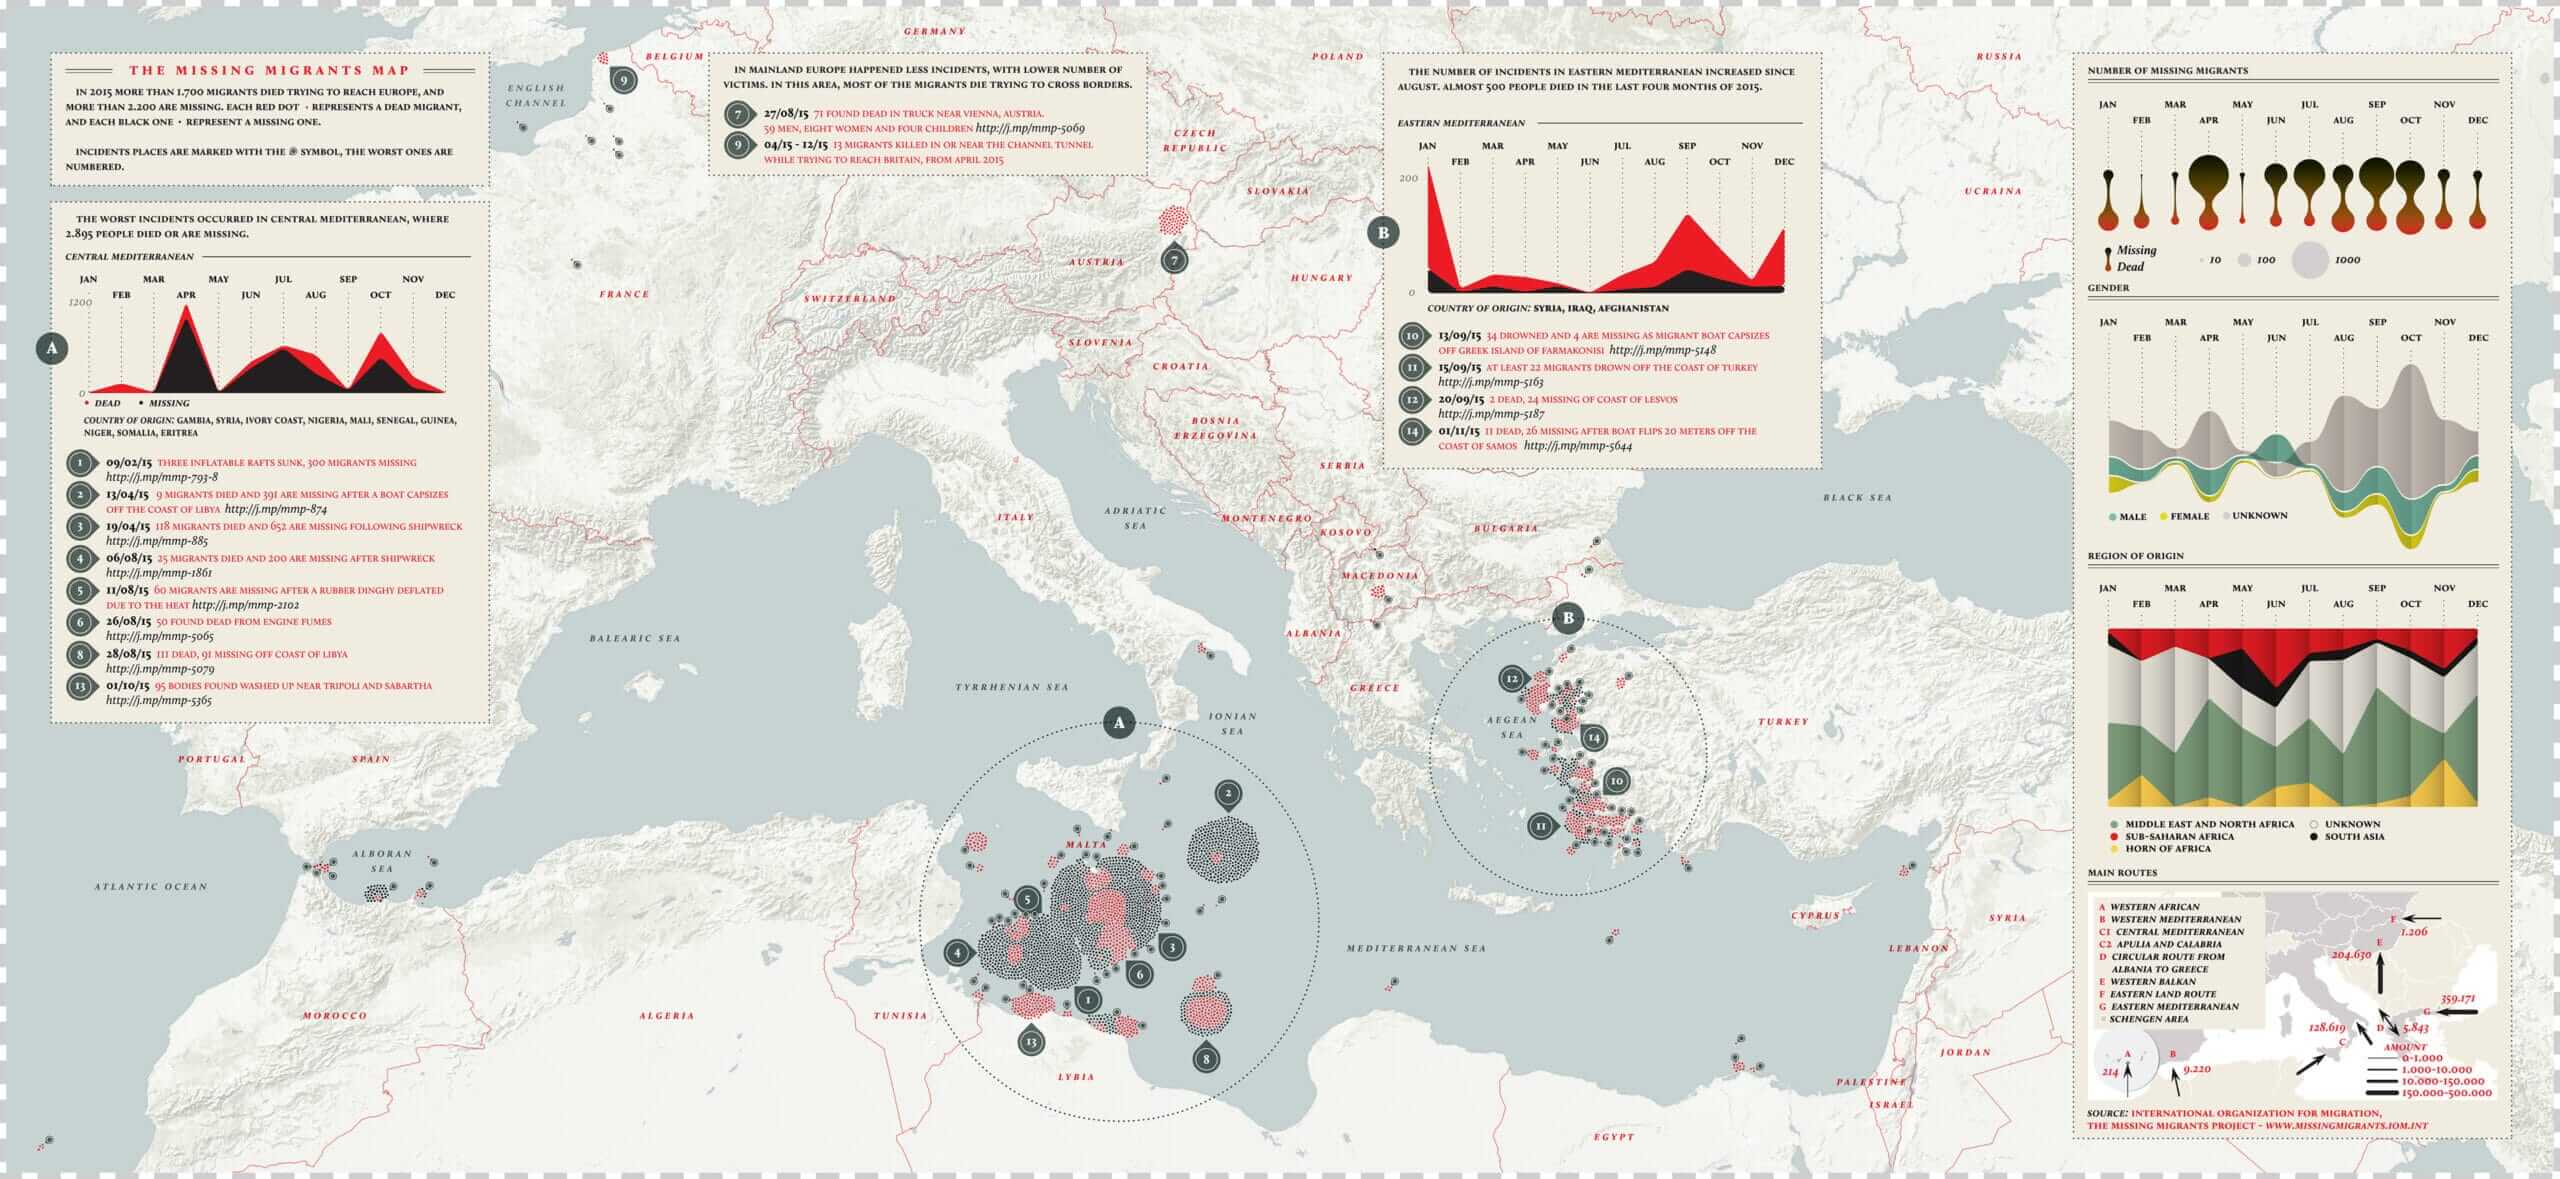
9. The Missing Migrant’s Map by Valerio Pellegrini and Michele Mauri
10. Nuclear Legacy by Greg McNevin
11. Let’s Do Brunch by Column Five

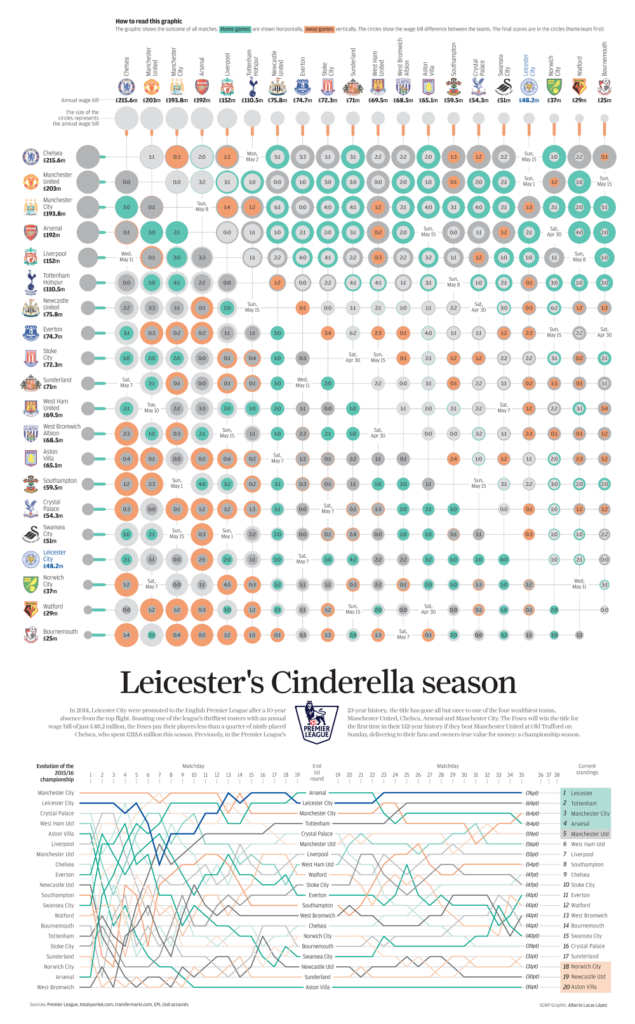
12. Leicester’s Cinderella Season by Alberto Lucas López
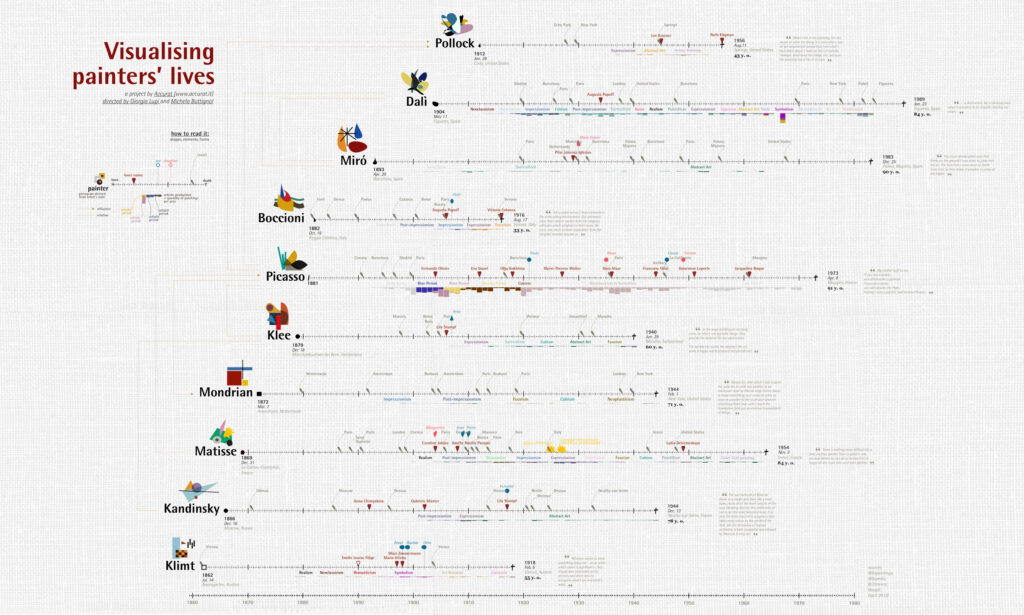
13. Visualizing Painters’ Lives by Accurat
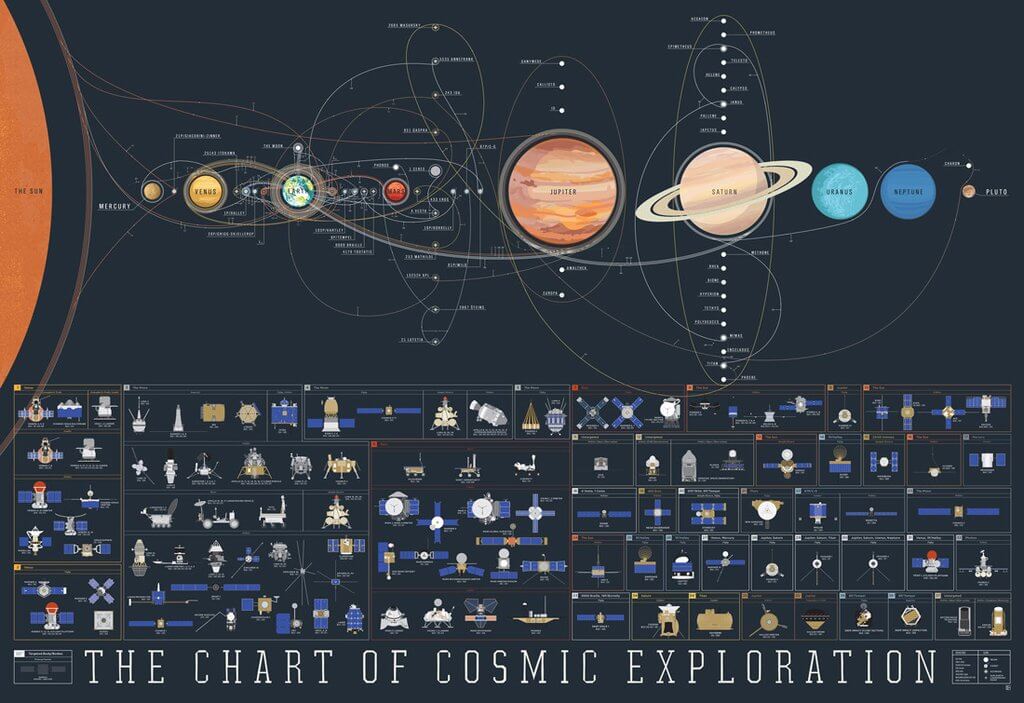
14. The Chart of Cosmic Exploration by Pop Chart Lab
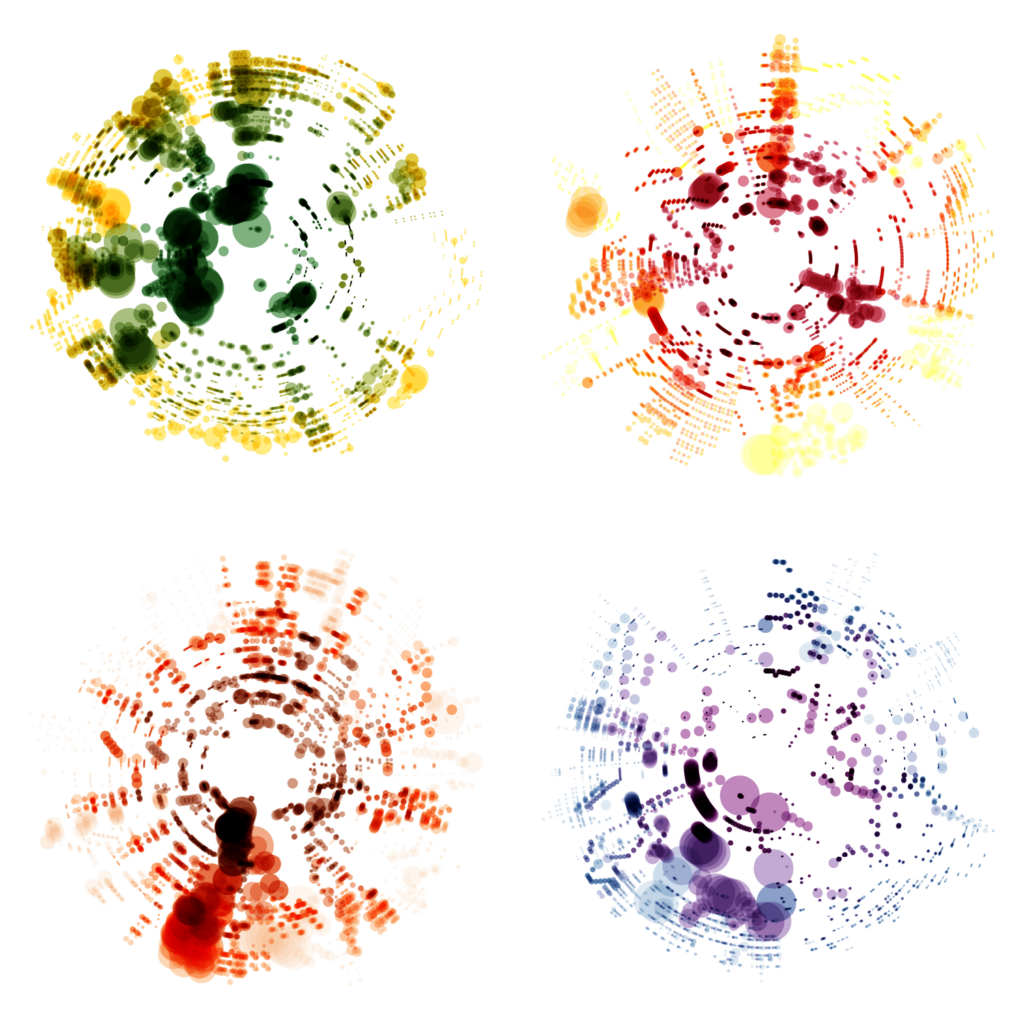
15. Seeing Music by Nicholas Rougeux





Thank you for the amazing blog post!
Nice post thank you very much. Waiting for more.