We’re gonna take a crazy guess and say that your brand has churned out a few infographics over the last few years. Those infographics are great, but too often we publish those infographics, promote them a few times, and forget about them. This is a huge opportunity wasted. If you have an archive of infographics (or any type of visual content for that matter), there are plenty of ways to repurpose, reuse, and remix them to get even more mileage. One of the best ways to do that? Bring them to life through motion by turning those static infographics into animated infographics.

Why Motion and Animated Infographics Benefit Your Marketing
How does motion improve the impact of your infographics? Here are 5 reasons it makes them more effective.
1) It Grabs Your Viewer’s Attention
Publishing platforms and social platforms have come a long way. They now support static images, video, and GIFs, meaning you have a lot more formats to play with. While static infographics are still effective, bringing a static infographic to life through motion makes your infographic even more dynamic and attention-grabbing. This is especially true for social, where you’re trying to stand out in a feed. (It’s also more likely to get you published, as publishers are always looking for A-plus visual content to enhance their own editorial mix.)
2) It Makes Your Marketing More Effective
Animated infographics can also make great additions to your email marketing. When Dell used a GIF-centric email campaign to promote a new product in 2014, they saw tremendous success, including a:
- 6% increase in open rate
- 42% increase in click rate
- 103% increase in conversion rate
- 109% increase in revenue
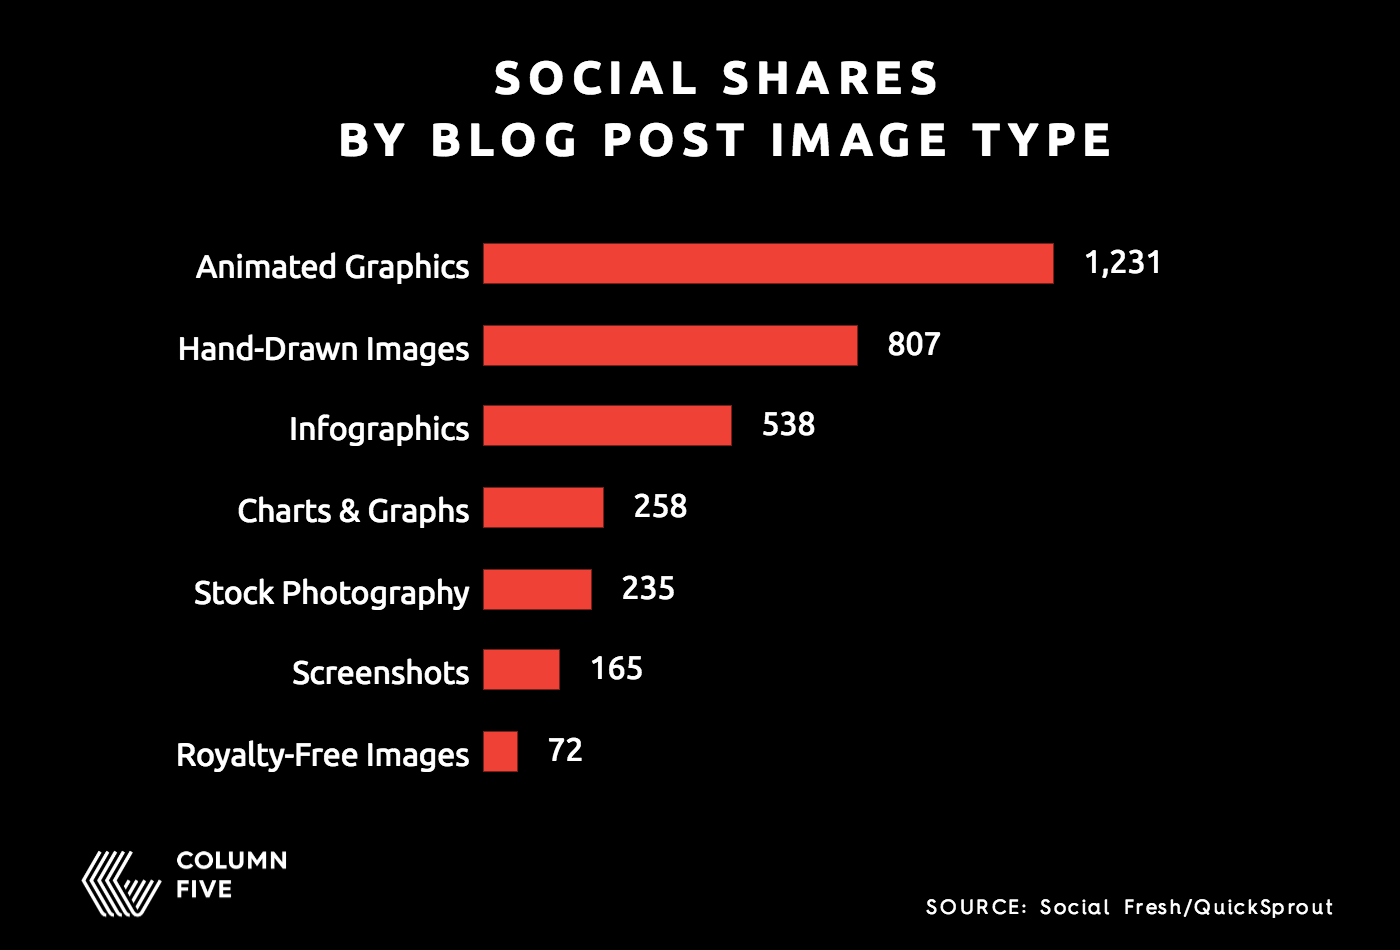
Additionally, GIFS are great ways to enhance your blogs. In 2014 QuickSprout analyzed 41 blogs across different industries to try to find a correlation between the type of images included in blogs and how many social shares those blogs earned. The results were pretty interesting; animated graphics grabbed the no. 1 spot.

3) It Makes Content Easier to Digest
Motion isn’t just about making things more attention-grabbing. It can be a great tool to increase comprehension. Turning your infographics into things like videos or motion graphics is an easy way to help your reader consume and synthesize the information in less time.
4) It Engages Your Viewer
Turning a static infographic into an interactive infographic is a great way to bring your viewer into the story. Even if your interactive presents a single narrative as a slideshow, it still requires them to click, consume, and explore the content. This active participation is more engaging than consuming a simple static infographic. (This is especially when it comes to data storytelling. For more tips on that, check our free e-book, The Content Marketer’s Guide to Data Storytelling.)
5) It Extends the Shelf Life of Your Content
This is one of the biggest benefits of repurposing your infographics. The more content you have, the more you can promote it. When you animate infographics, you can create additional assets, whether you pull a clip from an animated video, extract an animated panel, or share a GIF on social. This helps you promote on different platforms, enhance additional existing content (such as blogs), and tailor content for different groups of people.
4 Ways to Bring Your Infographics to Life With Motion
You don’t have to start by converting your entire infographic archive into motion masterpieces. Instead, you can experiment with one or two to start. Comb through your infographics and look for high-value evergreen pieces or infographics that could be updated or enhanced with additional information.
Luckily, your designers have already done the basic design work. That means you have a visual language, as well as assets to start with. This makes the process much easier than building motion pieces or animated infographics from scratch.
That said, deciding exactly how to animate it depends on the content you have and the story you’re telling. If you’re not sure, here are four types of motion and animation to explore.
1) Animated Infographics
Animated infographics are exactly what they sound like: Infographics that feature animation. These are great to help illustrate stories, demonstrate tutorials, break down concepts, etc. If you plan to turn your infographic into an animated masterpiece, we recommend designing it in sections that can be easily extracted to support other content.
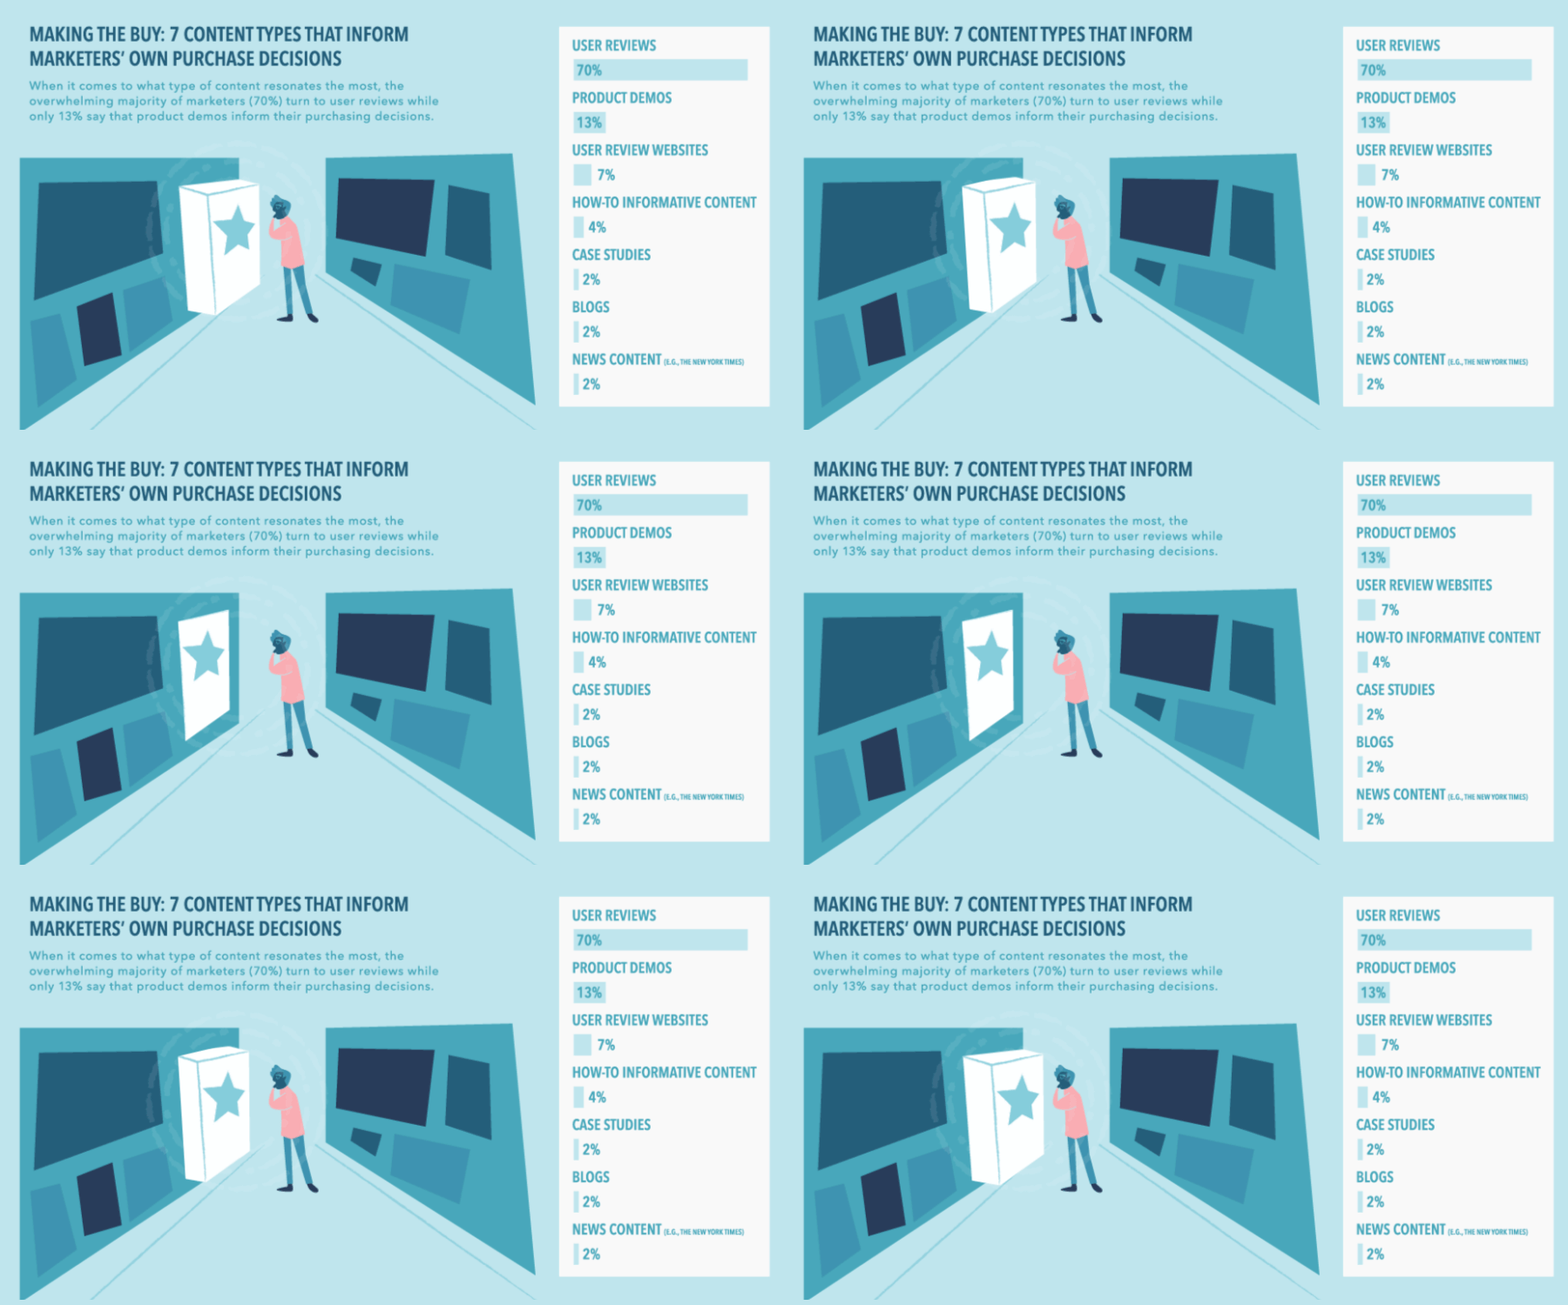
Example: We turned a Newscred survey into an animated infographic, designed in modular panels so that each section could be used individually.

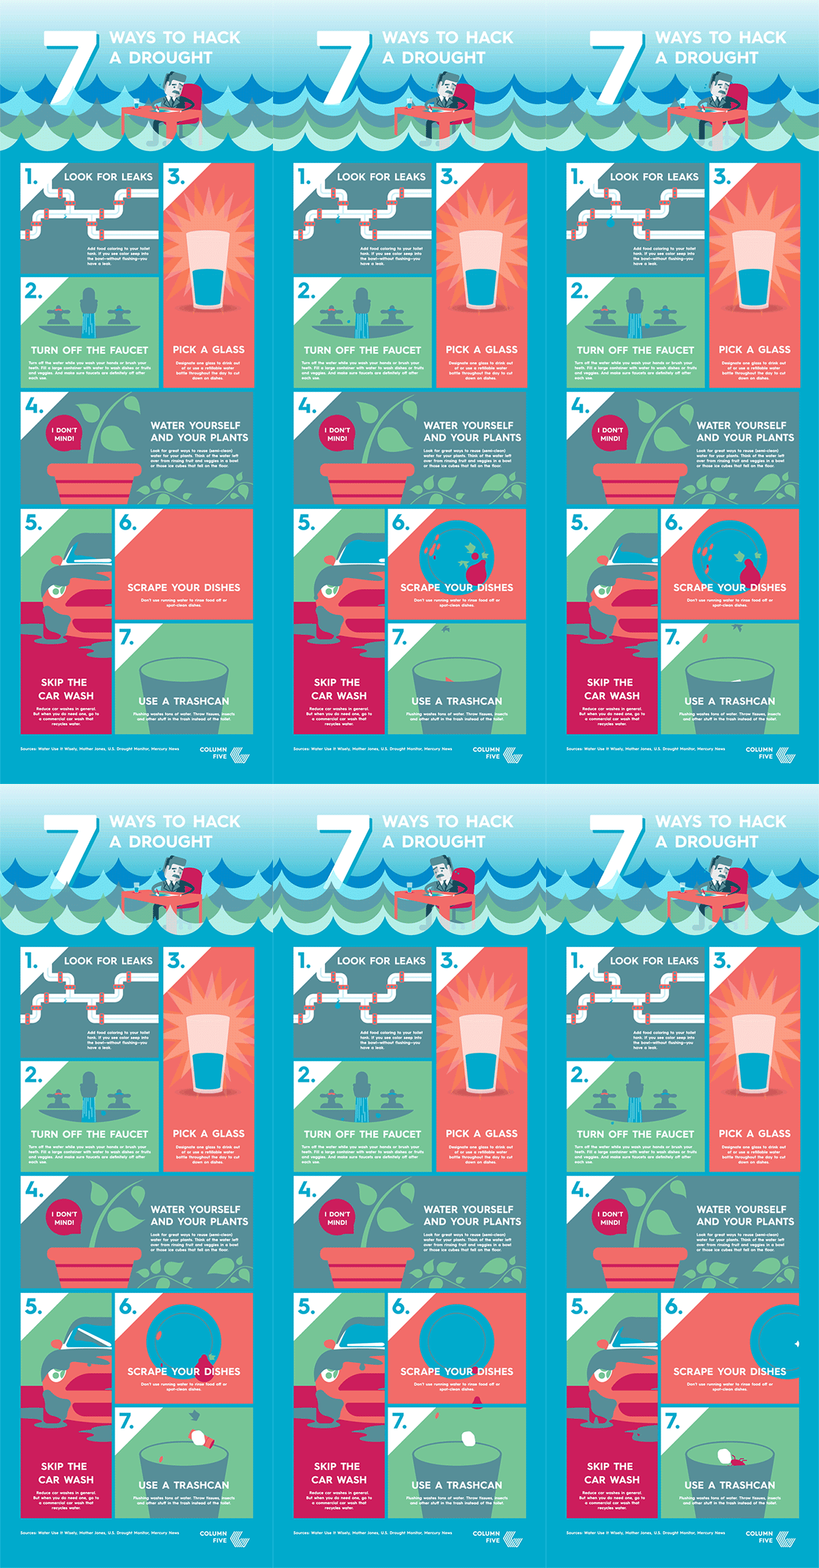
If you also just want to get your feet wet, encourage your team to experiment with an internal project. As part of our own content marketing, we created an animated infographic on tips to hack a drought, which let our team flex their creativity and bring the useful tips to life:

2) InfoGIFS
Technically, animated infographics are GIFS. But the GIFS most people are familiar with are those standalone little loops you see all over the Internet. Those little gems get shared for a reason. They’re simple, entertaining, and eye-catching.
They’re also pretty easy to make. You can make GIFS by animating single elements from infographics, or extracting smaller panels from your animated infographics. (Again, this is why we’re big fans of modular design.) Look at all the assets in your infographic, including illustrations and data visualization. If you can make it move, you can get even more attention.
Best of all, these make great microcontent for social and can be used to tease a larger piece of content. (This approach is a big part of a divisible content strategy, where you create additional assets from cornerstone pieces of content.)
Example: We partnered with Takepart to create a set of GIFS highlighting important statistics about veterans’ mental health. Though simple, the animated data visualizations make a powerful statement.

3) Motion Graphics
Video storytelling has exploded in the last few years, as more social platforms have expanded their video capabilities. People are particularly drawn to this format because it’s an efficient form of storytelling. A 2014 Levels Beyond survey found that 40% of consumers would rather watch a brand video than read the same information. (For more info on that, check out our interactive e-book, The Content Marketer’s Guide to Brand Video.) Video is also passive, so people don’t have to do anything but press play and kick back.
For that reason, turning your infographics into full-on motion graphics may be the right way to go, depending on your use case. Explainers, tutorials, or process overviews are particularly well suited for the motion graphic treatment as well.
Your motion graphics don’t even have to be that long. A single infographic can easily be distilled into a 30-second motion graphic, saving people time and energy in consuming the content. For more on creating motion graphics:
- Learn about the keys to a good motion graphic.
- Follow these tips to write a script your designers can work with.
- Find out how to figure out the right length for your motion graphic.
- Get inspired by watching these motion graphic examples.
Example: To celebrate Earth Week 2015, we created a motion graphic with NBC Universal, which featured stats about food waste in the U.S., as well as helpful tips to avoid it. It’s a simple story brought to life in only 45 seconds.
4) Interactive Infographics
Interactive infographics are an exciting way to bring viewers into your story. While they are often used to make large data sets easier to explore, they can also be a powerful tool for contained storytelling. You can turn an infographic into an interactive slideshow, guiding your reader through the content or adding additional content for them to explore. Again, the static assets you have make it easier to create interactives.
For more on creating great interactive infographics:
- Learn about why interactives are so effective.
- Ask yourself these 5 questions before you make an interactive infographic.
- Find out what makes a good interactive infographic.
- Check out these 101 examples of awesome interactive infographics.
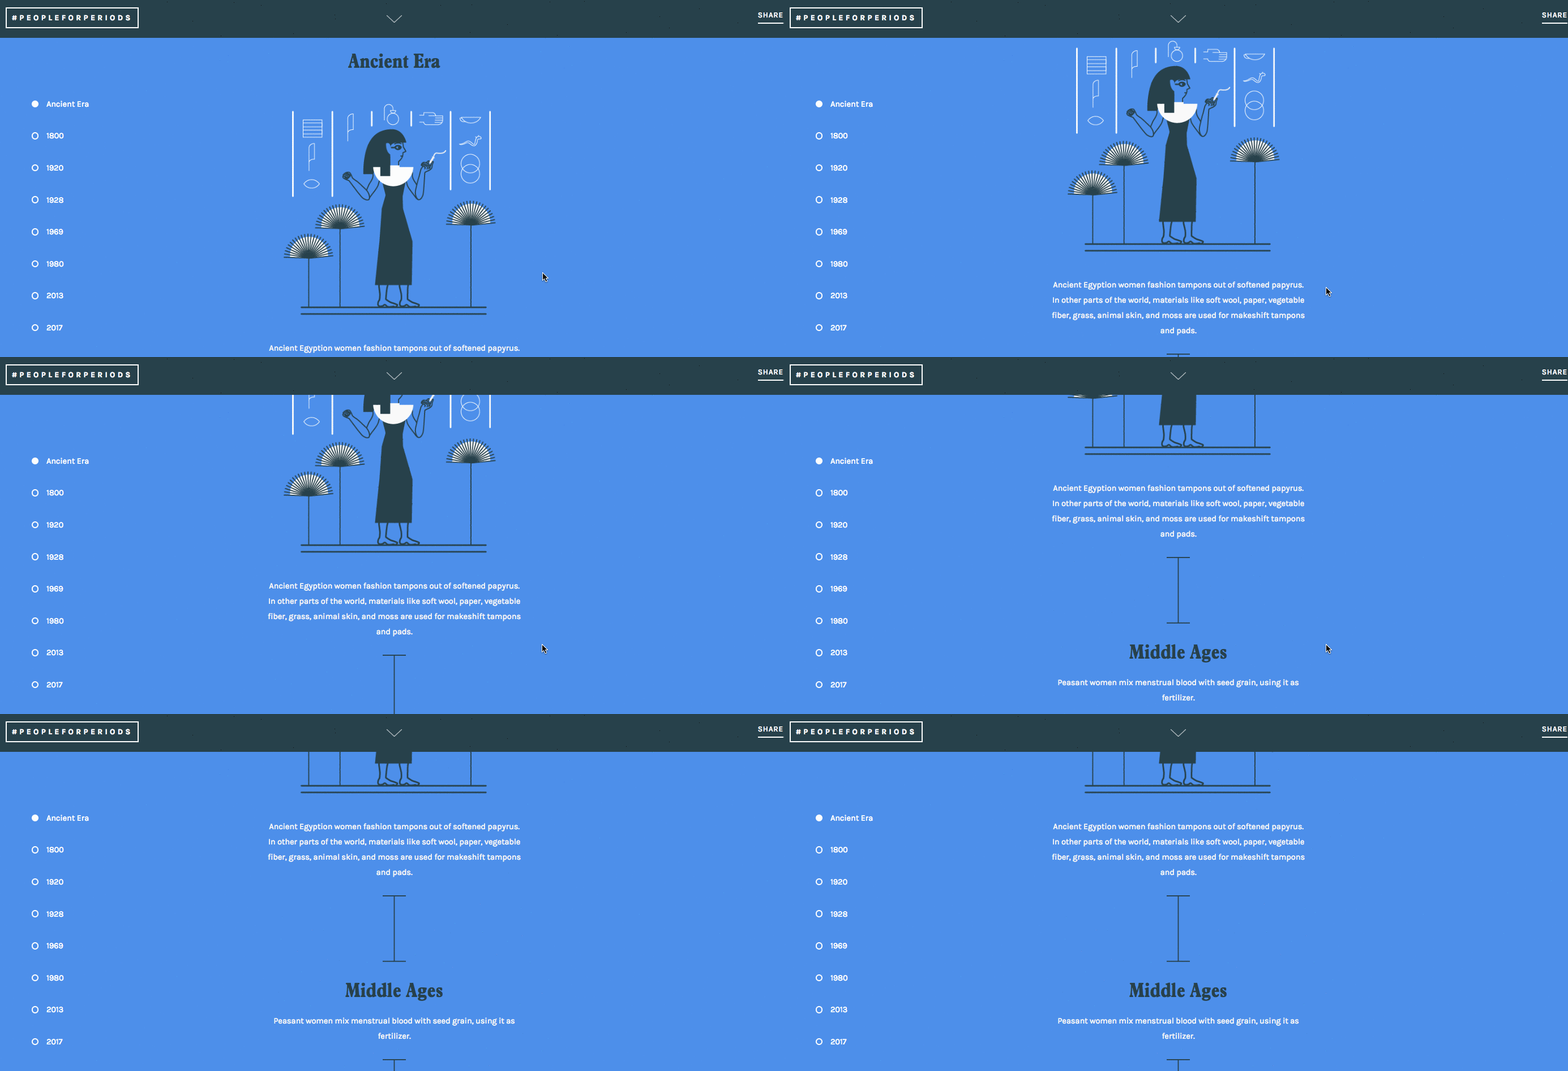
Example: Our People for Periods interactive infographic aims to destigmatize menstruation by guiding viewers through the history of menstruation, as well as the challenges that women and girls worldwide face today.

Consider More Ways to Repurpose Your Infographics
It takes a lot to create good content, so we think you should always get the most out of everything you make. If you’re looking for more ways to repurpose, reuse, or experiment with content, here are our best tips to get more from your infographics, e-books, and more.
- Try these 10 ways to repurpose your data visualizations.
- Learn how to turn your old e-books into fresh infographics.
- Mix up your designs by experimenting with these 7 infographic design styles.
- Find out what content might do better as an infographic (e.g., press releases, tutorials, etc.).
And if you need more ideas, let’s talk through them.


