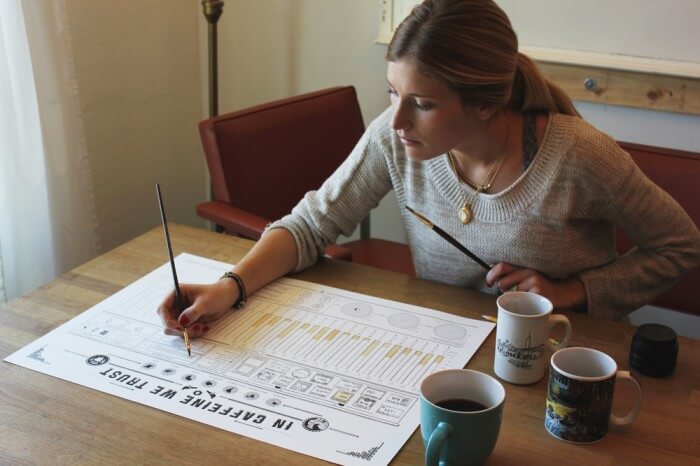
To show our appreciation for our clients and partners this holiday season, we put together a little project to allow them to share in our love for two important staples here at C5: caffeine consumption and data visualization. 150 of our clients, and 50 of our partners received a limited edition print of this interactive coffee poster, which provides a canvas to track consumption data over the course of a month. The instructions outline a few calculations to analyze personal consumption trends. Once monthly tracking is complete, the drinker can use their coffee (or a stronger version thereof) to ‘paint’ their data onto the poster to complete the visualization.
[wide] [/wide]
We also included a half pound of coffee from our friends at Lord Windsor Roasters, a local micro-roastery. After each poster is complete with the month’s visualization, clients and partners will send in a photo to put their name in the hat for a year’s supply of coffee. Two clients and one partner will be selected at random for the prize.


NEED HELP CREATING EFFECTIVE VISUAL CONTENT? LET’S CHAT.